Was SK Hynix's US Debut The AI Bubble Top? BNP Says It's Still 1998

The short version
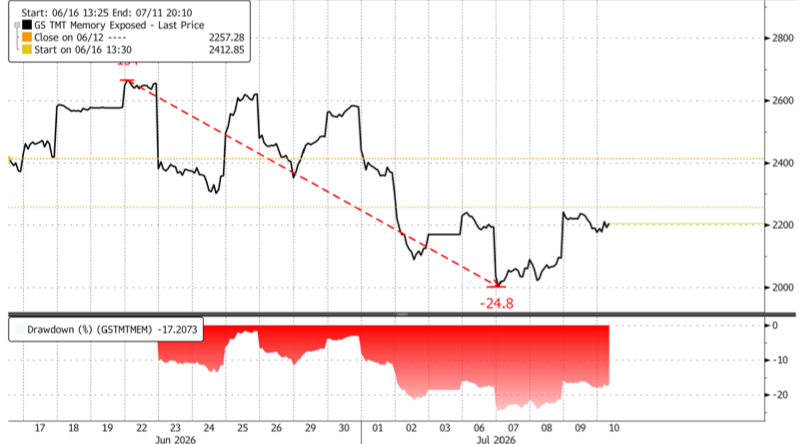
- Zooming in on the recent price action in the GSTMTMEM Index: That rollover has since spread into the broader South Korean market…
- Adding to the AI bubble doomerism camp is UBS' proprietary Market Fragility Index, an internal risk gauge measuring how vulnerable markets are to a sharp reversal or volatility…
- UBS proprietary market fragility index hits all time high pic.twitter.com/zwOUS0dbGk — zerohedge (@zerohedge) July 10, 2026 But not everyone on Wall Street is pessimistic…
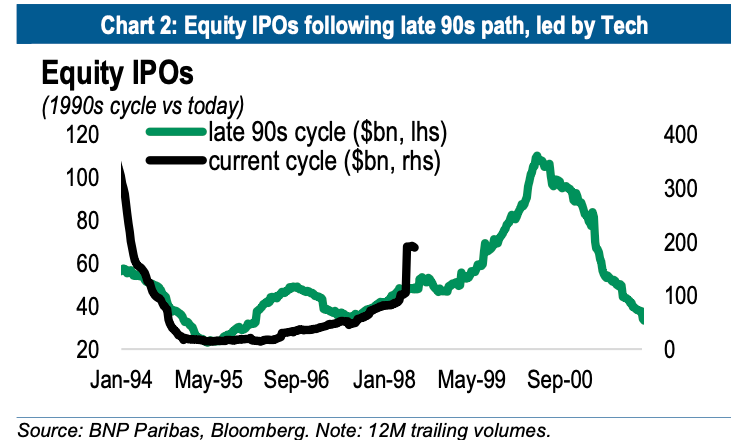
- Chart 2: Equity IPOs following late 90s path, led by Tech We analysed the extent to which the AI buildout is evolving in line with previous industrial bubbles.
- The late 1990s provide a fitting playbook.
The story
With SK Hynix's American depositary receipts now trading under the temporary ticker SKHYV as of late Friday morning, the seven-times-oversubscribed offering highlights Wall Street's rush for more direct exposure to high-bandwidth memory amid the AI infrastructure boom.
Against the backdrop of mounting concerns about an AI infrastructure bubble, Roth Capital Partners' sales trading team asked clients earlier Friday: "How will investors, looking back two years from now, view the timing and significance of SK Hynix's US offering?"
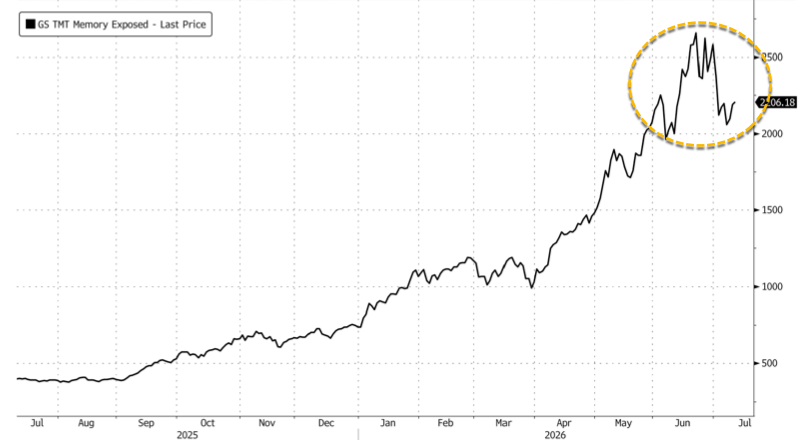
Taking a look at the GS TMT Memory Exposed Index (GSTMTMEM Index), Goldman Sachs' thematic basket tracking companies with high exposure to the memory chip cycle, the trade appears to have peaked in mid-June.
Zooming in on the recent price action in the GSTMTMEM Index:
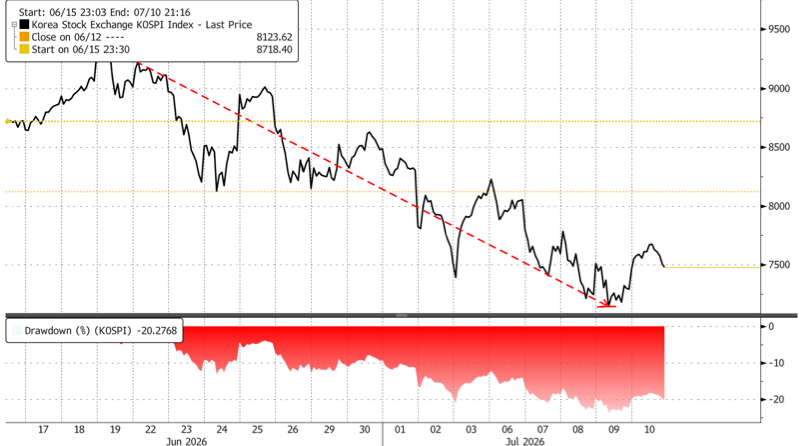
That rollover has since spread into the broader South Korean market, with the Kospi entering a bear market this week as the memory stock euphoria begins to fade.
Adding to the AI bubble doomerism camp is UBS' proprietary Market Fragility Index, an internal risk gauge measuring how vulnerable markets are to a sharp reversal or volatility shock, which currently prints at an eye-popping high.
UBS proprietary market fragility index hits all time high pic.twitter.com/zwOUS0dbGk
— zerohedge (@zerohedge) July 10, 2026
But not everyone on Wall Street is pessimistic, and analysts at BNP Paribas say the AI boom increasingly resembles the late 1990s.
João Torres, a European credit strategist at BNP Paribas based at the bank's Portugal branch, penned a note on Friday with a title that suggests the AI bubble has more room to inflate: "The Bubble Playbook: It's still 1998."
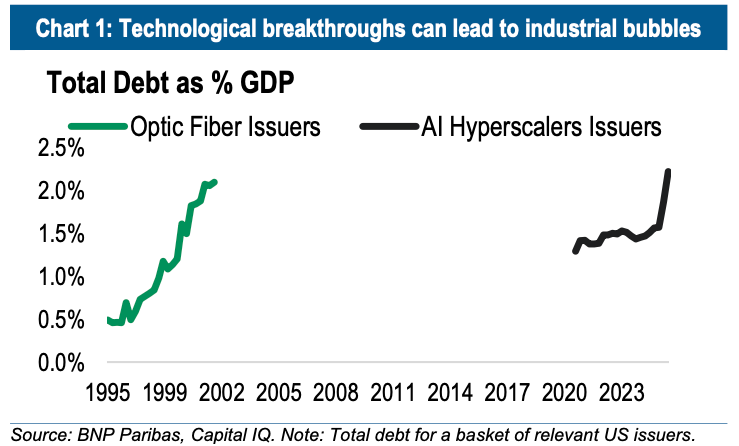
"Technological progress can create industrial bubbles. Chart 2: Equity IPOs following late 90s path, led by Tech We analysed the extent to which the AI buildout is evolving in line with previous industrial bubbles. The late 1990s provide a fitting playbook. In our view, AI has similarities of an industrial bubble but is not yet extreme," Torres wrote in the note.
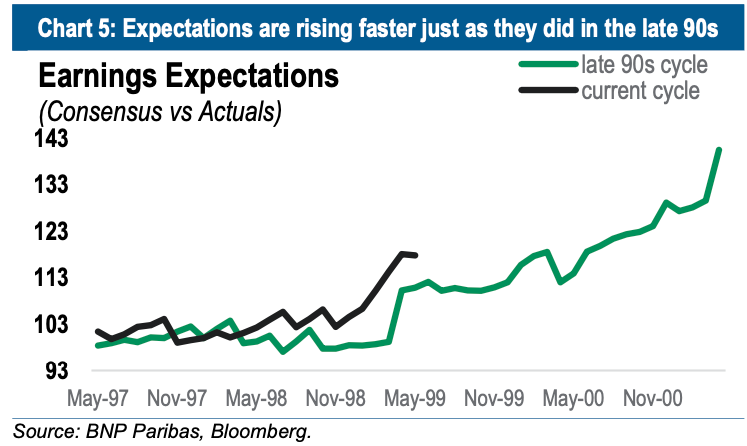
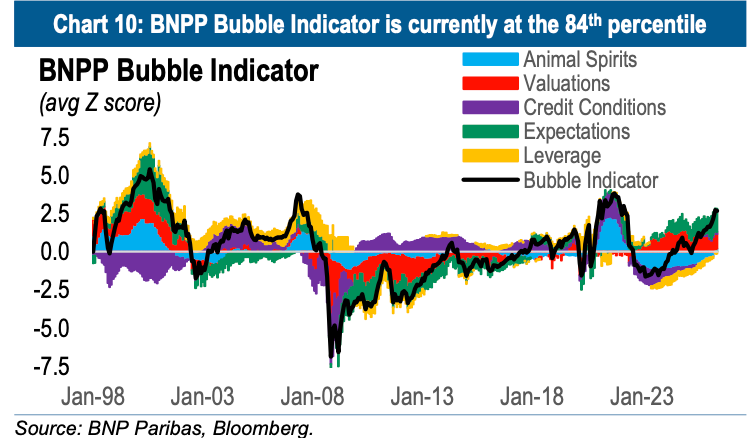
The BNPP Bubble Indicator currently stands around the 84th percentile, driven by elevated animal spirits, valuations and earnings expectations. At that level, near-term stock returns could be positive, but historical patterns suggest softer performance over six to 12 months if the indicator moves to the 85th percentile level.
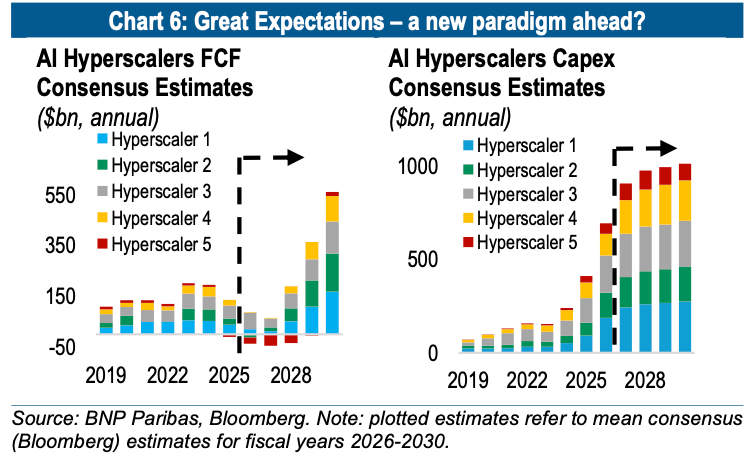
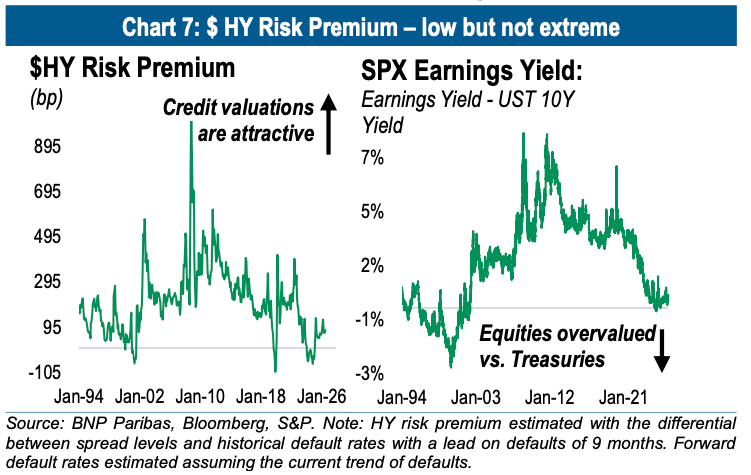
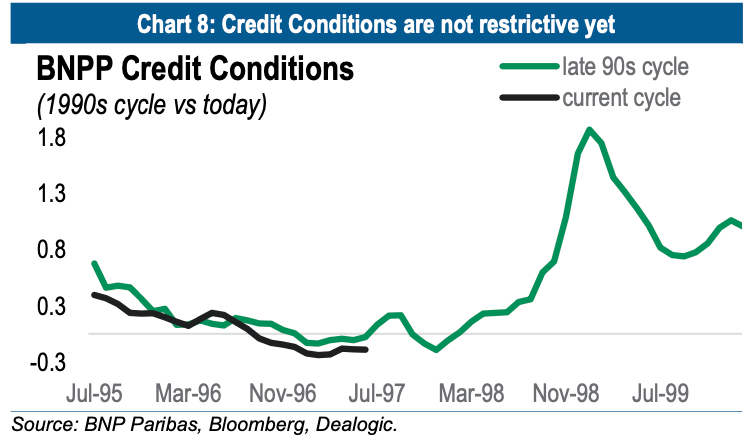
Torres put together a compelling chartpack that suggests today's environment is more like the late 1990s:
Chart 1: Technological breakthroughs can lead to industrial bubbles
Chart 2: Equity IPOs following late 90s path, led by Tech
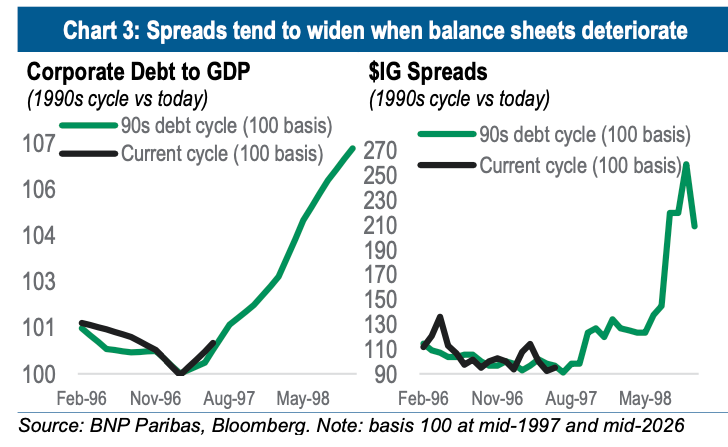
Chart 3: Spreads tend to widen when balance sheets deteriorate
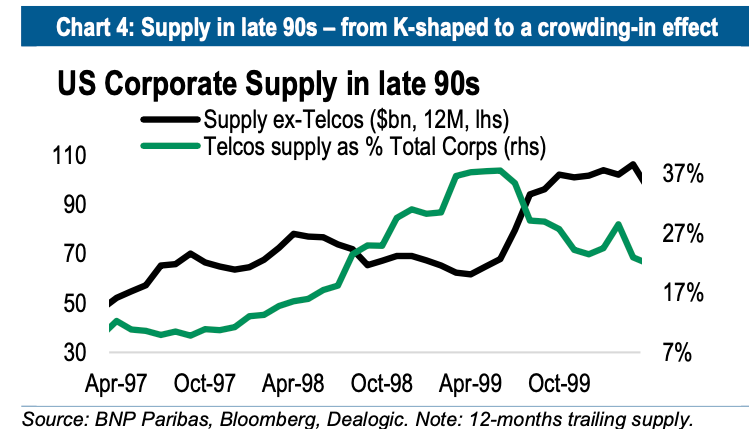
Chart 4: Supply in late 90s – from K-shaped to a crowding-in effect
Chart 5: Expectations are rising faster just as they did in the late 90s
Chart 6: Great Expectations – a new paradigm ahead
Chart 7: $ HY Risk Premium – low but not extreme
Chart 8: Credit Conditions are not restrictive yet
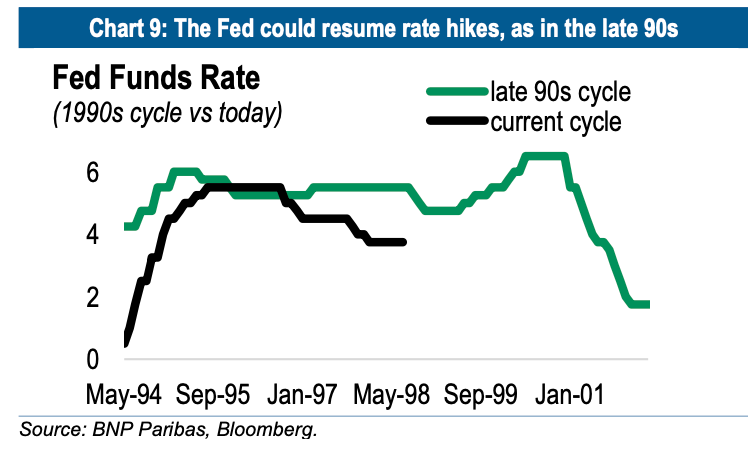
Chart 9: The Fed could resume rate hikes, as in the late 90s
Chart 10: BNPP Bubble Indicator is currently at the 84th percentile
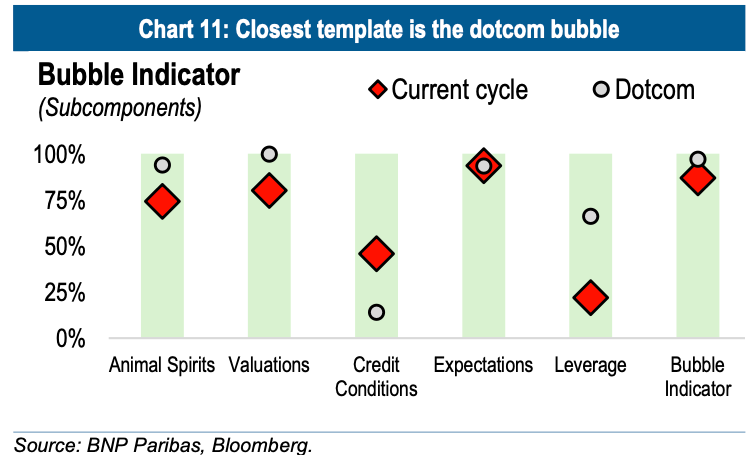
Chart 11: Closest template is the dotcom bubble
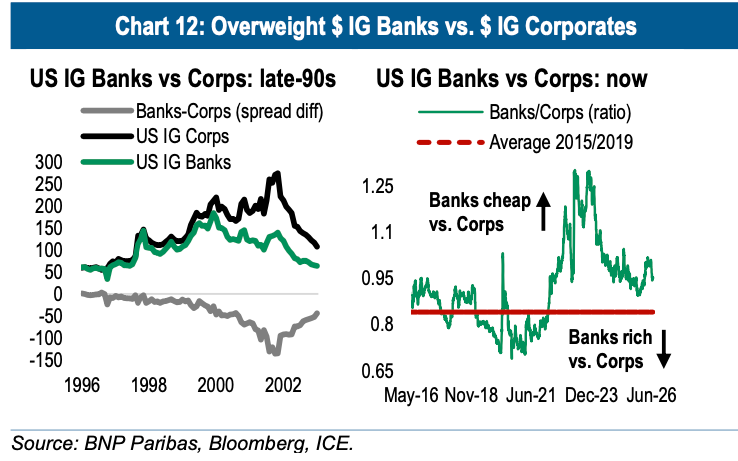
Chart 12: Overweight $ IG Banks vs. $ IG Corporates
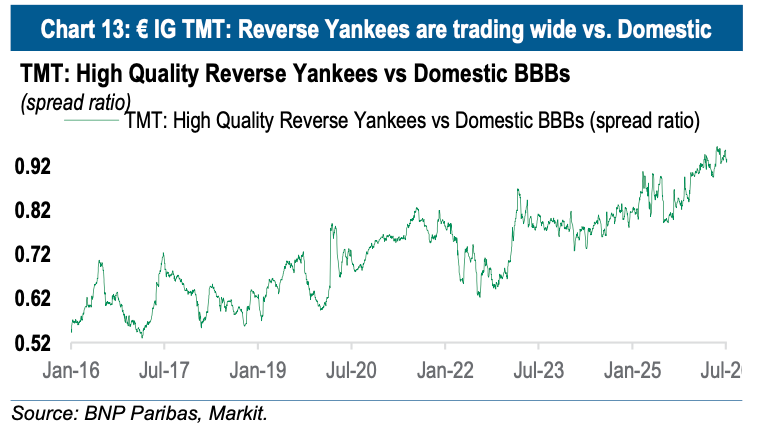
Chart 13: € IG TMT: Reverse Yankees are trading wide vs. Domestic
Professional subscribers can read more on memory and KOSPI at our new Marketdesk.ai portal.
Related Markets
All MarketsMarket data may be delayed. Not financial advice.
Powered by Gab AI
The Story At A Glance
Reading this article now — analysis appears below
💡 AI analysis provides alternative perspectives on current events