Record Highs: Should You Chase The Rally?
Authored by Lance Roberts via RealInvestmentAdvice.com,
Pinned and Stretched
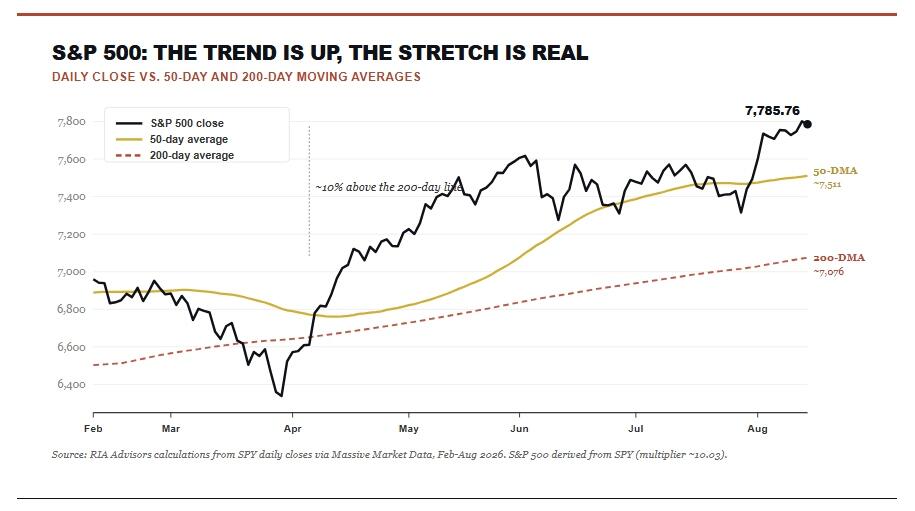
There is nothing bearish about the tape, and the overall trend could not be much cleaner. The S&P 500 sits above every major moving average and above a rising 200-day line it has not closed beneath since April. That is a healthy, intact uptrend, and it deserves respect. The problem is not the direction, but the distance from the longer-term trend, which is more concerning. As is always the case, deviations above the long-term trend eventually “revert to the mean.” We see it almost every year.
At Friday’s close, the index sat roughly 10% above its 200-day moving average. That is one of the widest gaps of this entire cycle, and it sits about 3.7% above the 50-day line, too. Add our Money Flow and Breadth Indicator at 80%, with 72% of members above their own 200-day average. This market has done a lot of work in a short window. Friday’s quiet fade from record highs is the kind of small caution flag that shows up when a tape gets this extended.
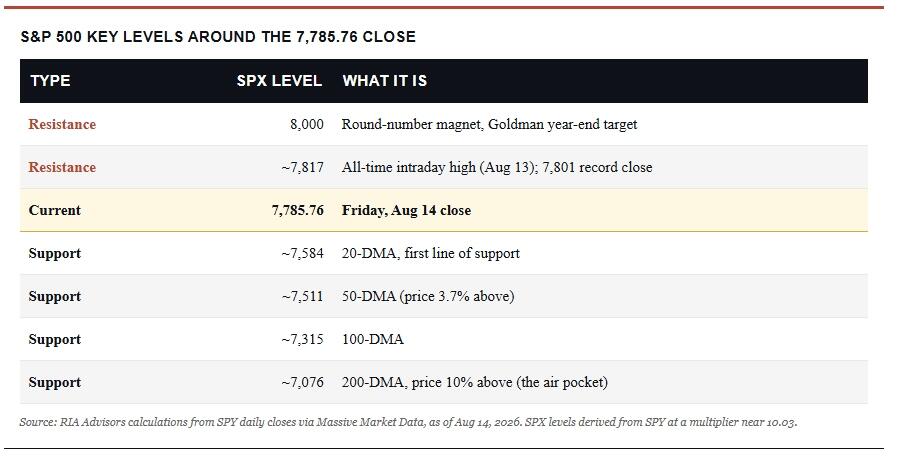
Look at the ceiling first. Price is pressed right against its own record highs, with Thursday’s 7,801 close and 7,817 intraday high just overhead. Above that sits the round 8,000 mark, which also happens to be Goldman’s year-end target. Round numbers act like magnets until they act like ceilings, so that’s where sellers tend to dig in. The floor sits much further away. First support is the 20-day line near 7,585, then the 50-day line near 7,510, both comfortably below Friday’s close. The takeaway is the asymmetry. There’s little cushion above, and plenty of open air below, down to those averages.
Neither support level is very far away, and a pullback to either would be routine housekeeping within an uptrend, not a break of it. The number that matters for risk is lower down. As noted, the gap from here to the rising 200-day line near 7,076 is roughly 10%, and that mean-reversion “air pocket” is the risk. The trend remains up, but momentum is overbought; therefore, entries here offer poor near-term reward relative to risk.
Record Highs: Should You Chase The Rally
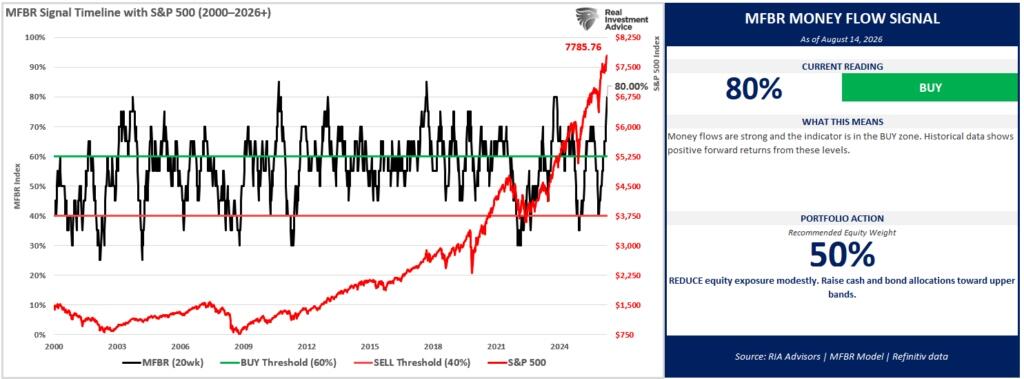
Last week in the Bull Bear Report, I flagged that our Money Flow and Breadth Indicator had pushed into extreme overbought territory. This week, it pushed even further.
“As of August 14, 2026, with the S&P 500 at 7,785.76, the Money Flow Breadth Ratio (MFBR) stands at 80% and rising, versus 75% the prior week – a 15 percentage-point increase over the trailing four weeks. This places the indicator in extreme overbought territory (75% or higher). The raw breadth signal still reads BUY, but the MFBR is a contrarian indicator at extremes: readings this stretched have historically been followed by below-average forward returns, so the model treats this as a caution flag rather than a green light to add risk.“
Regardless, the market shrugged, as it tends to do when momentum runs this hot. The S&P 500 is back near record highs, just under 7,800, and suddenly everyone wants back in the pool. So, here is the honest question before us this week:
“Should you keep chasing record highs here, or is the smarter move to participate while quietly managing the risk building underneath it?”
The Inflation Data Just Made The Bulls’ Job Easier
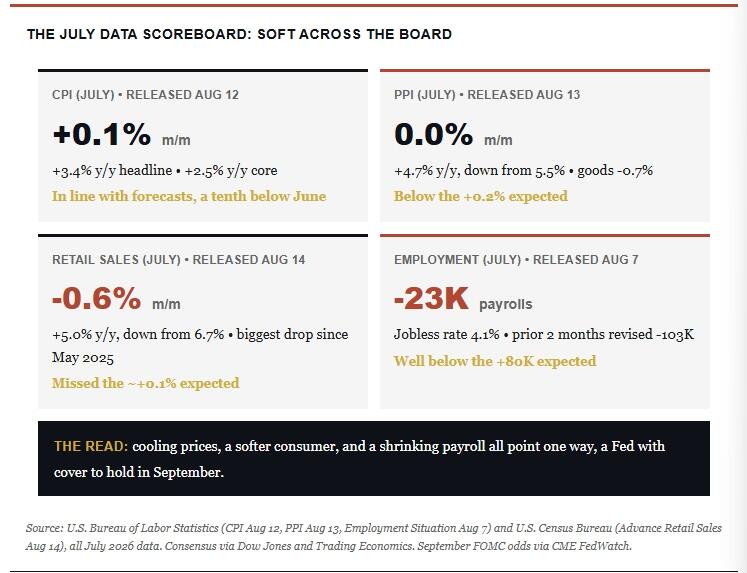
Before we answer that larger question, let’s touch on what changed this week. Both inflation reports came in soft. July CPI rose just 0.1% on the month and 3.4% over the year, with core at 0.2% and 2.5%. The reports were all in line with forecasts, and the shelter reading did most of the lifting, a slow-moving piece that the Fed will likely fade. The next morning, PPI landed flat at 0.0% versus a 0.2% gain expected, and the annual rate cooled to 4.7% from 5.5%. Final demand goods prices actually fell 0.7%. The tariff “passthrough” the hawks keep warning about simply hasn’t shown up in the pipeline yet, a point I walked through in Friday’s commentary.
That data is important, as the upcoming FOMC meeting in September won’t be about rate cuts but rather about a small minority of “hawks” rescinding their previous dissenting opinions. Coming into the week, futures had the September meeting near a coin flip. After the CPI print, the odds of the Fed holding rates jumped to roughly 64%, and the soft PPI only reinforced that move. A hike on September 16 is now the least likely outcome, particularly following very weak employment and retail sales reports.
For stock buyers, a Fed parked on hold removes the one macro tail risk that could have knocked a richly priced tape off course, a surprise hike into record highs. Notably, the recent data isn’t the same as “all clear,” and inflation is still running north of 3% keeps the Fed on hold for now. However, the near-term policy threat is smaller, and that is precisely the backdrop that emboldens buyers.
Speaking of that, let’s talk about who has been buying this market lately.
The Buyer List Behind Record Highs Keeps Growing
Give the bulls their due, because the setup is real. Scott Rubner at Citadel Securities laid out his “buyer checklist” this week, and it keeps getting longer.
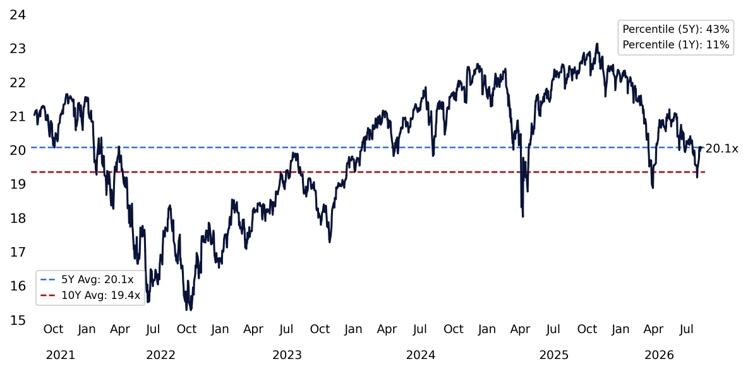
Earnings are carrying the load, with Q2 profits for the index growing roughly 33%, one of the steepest revision paths in a quarter century. Furthermore, the forward multiple has actually fallen to about 20x earnings from 23 last October.
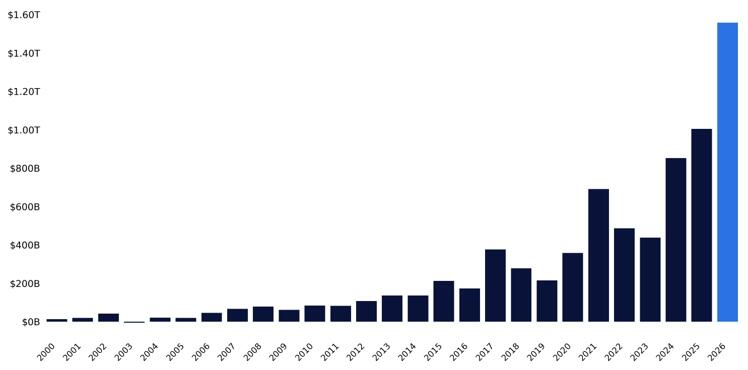
In other words, earnings are doing the heavy lifting, not “easy money” multiple expansion. Passive demand never blinked either. Households pushed a record 350 billion dollars into ETFs in July alone, part of 1.6 trillion in year-to-date inflows.
More than a trillion dollars of buyback authorizations reopen this month, and nearly 70% of them sit outside Technology.
When several sources of demand strengthen simultaneously, and selling pressure fades, the path of least resistance is higher. Breadth has healed, volatility has fallen, and the same rule-based strategies that were dumping stocks in the spring can start buying them back. Such is the mechanical reality of this tape right now.
That is the bull case, and it is a compelling one. However, a market where the buyer list is this crowded, moves this fast, and is on the heels of a 26th record high for the year, is also a market where the easy part of the move is behind us. In other words, it is now the marginal new buyer who is “paying up” for exposure near the highs.
Retail Is Back, And Buying What Already Burned It
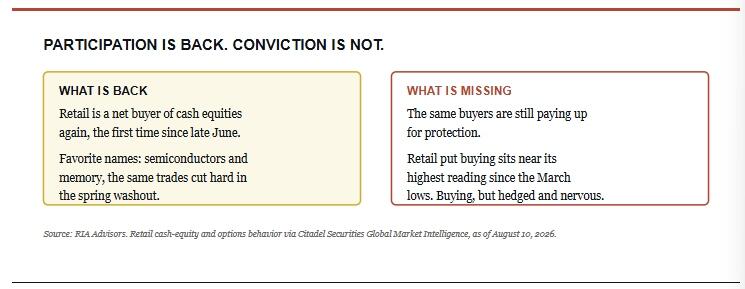
As noted above, retail investors returned as net buyers across Citadel’s platform with a vengeance, reversing the selling seen at the end of June. However, while participation is back, conviction seems to be lacking. The same traders buying cash equities are still paying up for downside protection. Put buying sits near its highest reading since the March lows, and “what” they are buying is notable. Over the last two weeks, retail’s most-bought names were semiconductors and memory, the exact “story” trades that got cut hard in the summer washout.
We wrote about one flavor of this on Monday in Leveraged ETFs: Math Often Trumps Hype, where a widely shared post pitched a 2x-leveraged SK Hynix fund as “magnified exposure” to a doubling of the stock. The math does not work that way in option-backed ETFs. Daily resets and volatility decay mean a leveraged fund can end a year in the red even when the underlying stock doubles. Buying the same crowded names that already burned you, and doing it with leverage, is not a strategy. It is a “this time is different” bet.
The question, naturally, is if the flows are this strong, why fight them? I am not saying fight them. I am saying do not confuse a strong tape with a safe entry point.
Stretched Breadth: A Reason To Chase Record Highs?
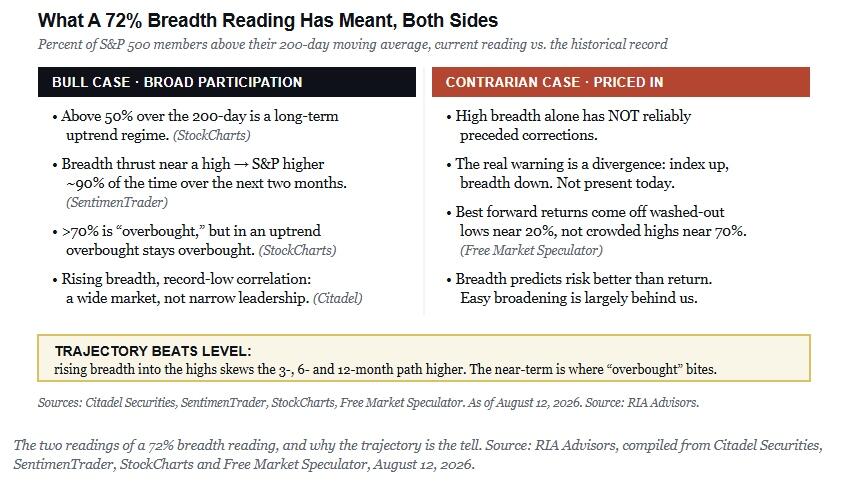
As discussed in yesterday’s Daily Market Commentary, market breadth is very healthy. As noted above, more than 72% of the S&P 500 now trades above its 200-day moving average, the broadest participation since December 2024, up from a washed-out 41% this spring, and cross-stock correlation sits near record lows.
Historically, when more than 50% of stocks are trading above their 200-day moving averages, it indicates a long-term uptrend. As StockCharts has noted for years, readings north of 70% are technically overbought, yet in a real uptrend, overbought stays overbought. Over the next 6-12 months, broad market participation like this has been a tailwind more often than not. Citadel’s own point reinforces this:
“Breadth is rising while cross-stock correlation sits near record lows, indicating a wide market, not a narrow pocket of leadership.”
From a contrarian view, this is also where the risk resides. Elevated breadth by itself has NOT reliably preceded corrections. What precedes them is a divergence, the index pushing to new highs while fewer stocks tag along. We don’t have that today, as breadth is rising into the highs rather than fading beneath them.
Here is what you should take away from this data. The biggest forward returns show up after washed-out lows near 20%, not after the crowd is already all-in near 70%. In other words, breadth predicts risk better than it predicts return. While over the next 3, 6, and 12 months the odds tilt toward higher returns, the next month is the stretch when an overbought tape can correct without changing the larger trend.
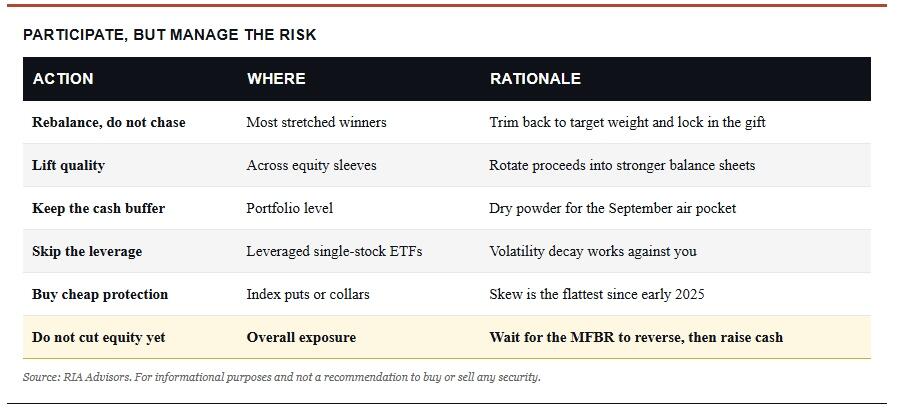
That is exactly why this past Monday, we took profits in winners like MSFT across the Equity 60/40 Portfolio and the Dividend Growth Model, and rebalanced the AI, Crypto, and Infrastructure thematic sleeves back toward target weights
The “Supply Of Stock” Nobody Is Talking About
With the market now back to more overbought conditions, what could cause the next correction? Is there a “supply of stock” waiting above current levels, where “trapped longs” who bought the previous semiconductor highs and rode them down into the lows will look to sell the instant they get back to breakeven? The honest answer is: yes, but less than a classic top. In a classical textbook distribution-topping process, the index pushes to record highs while fewer and fewer stocks tag along. That “divergence” is what marks the overhead supply. Currently, we do not see that in the data, particularly with breadth rising into the highs, not fading beneath them.
When overall market participation is high, and prices reach record highs, most of the buyers who were underwater relative to the old highs are getting whole and holding, not dumping. That is the difference between a market building a base of support and one quietly distributing stock to the next greater fool. Do not confuse less supply with no risk, though. Such is where the calendar comes in.
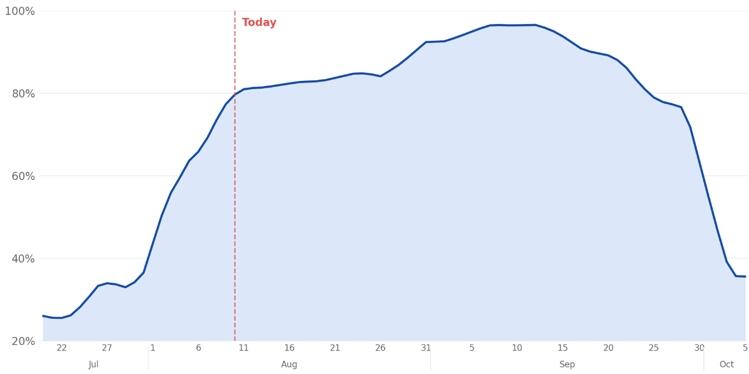
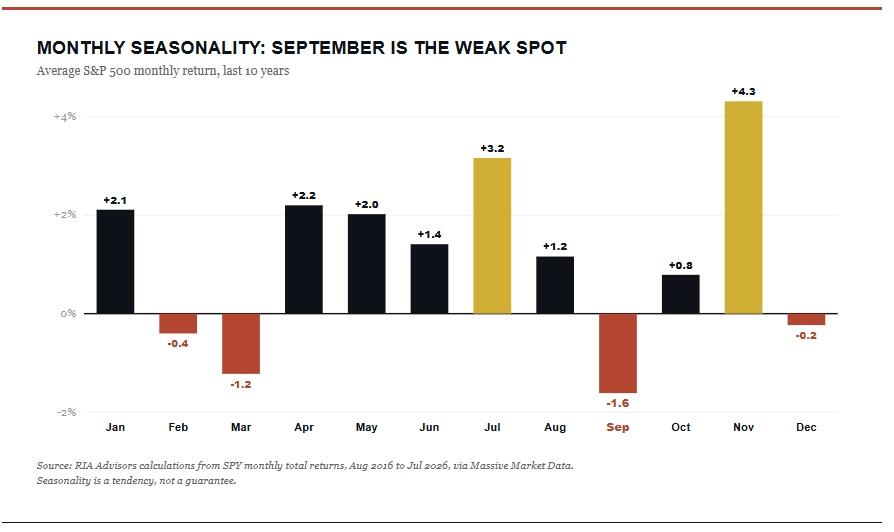
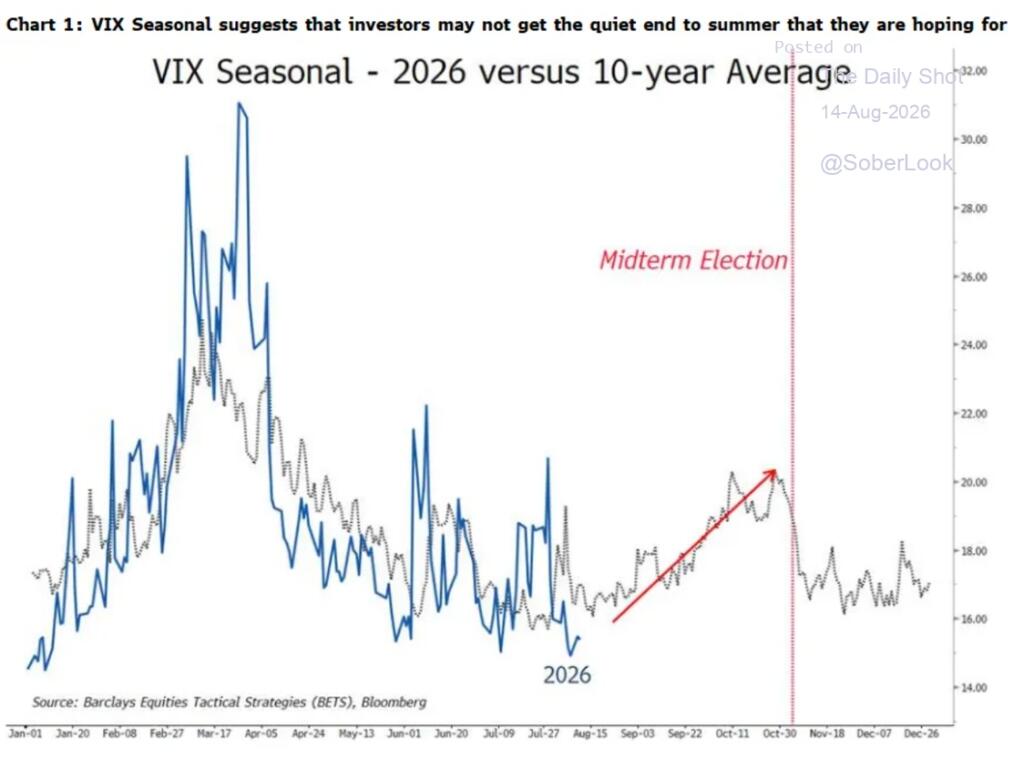
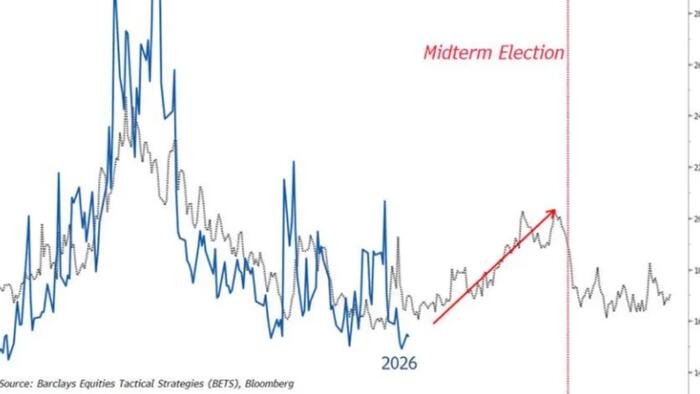
As shown in the chart above, September is typically the weakest month of the year for stocks. Over the last decade, the S&P 500 has averaged a loss in September and finished higher only half the time, the worst reading of any month on the calendar. Now layer the events on top. A September 16 FOMC meeting with a fresh dot plot, a midterm election on November 3 that reliably injects volatility, and a VIX pinned near 14.6 after spiking toward the low 30s in the March selloff. The VIX seasonal pattern points in the same direction. Volatility tends to trough right about now and grind higher into the fall, and it does so more dependably in a midterm year.
A compressed VIX is not a signal to sell. It is a signal that protection is cheap, right before the calendar turns hostile.
Key Catalysts Next Week
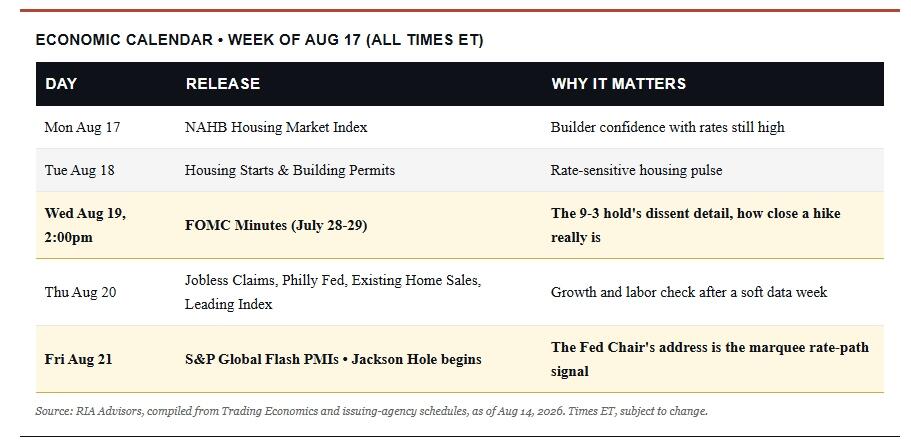
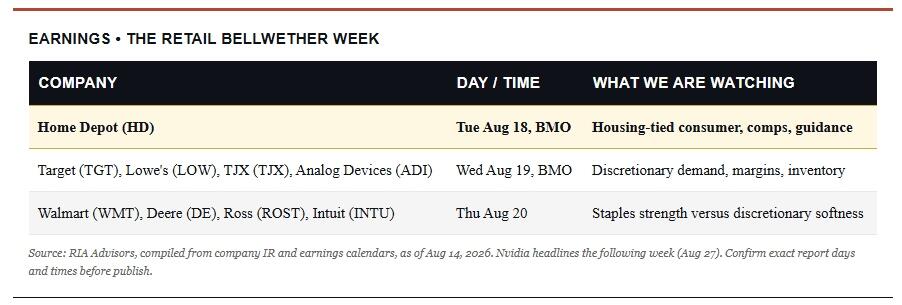
Next week hands us the two things this tape cares about most. We get a fresh read on the consumer and the Fed. After Friday’s soft retail sales print, the retail bellwethers offer a real-time answer to the same question. The FOMC minutes hit on Wednesday, and Jackson Hole starts Friday, pushing the rate-path debate back to center stage. All of it lands right before the September 16 meeting.
This week, we also get numbers from key retailers to gauge consumers’ actual health. Are high oil prices finally creating some demand destruction in the economy? Or is slower job growth showing up in consumer spending that suggests the economy is slowing more than expected?
The through-line is simple. Say the retailers echo Friday’s soft sales, and the minutes show a Fed leaning toward patience. Then the “Fed on hold” story we lean on gets firmer footing. If a hawkish surprise turns up at Jackson Hole, the calm priced into that 14-handle VIX gets tested in a hurry. Either way, the playbook holds, and this is a week to hold quality, keep the cash buffer, and let the tape come to us.
What Should Investors Do Now
So what do you actually do with all of this? For now, continue to participate while managing your risk. Those two actions are not in conflict and do coexist successfully. The trend is up, breadth is broad, and the flows are real, so this is not the moment to run to cash. It is the moment to stop chasing record highs and start rebalancing.
Consider the setup on both sides. Goldman just raised its year-end target for the S&P 500 to 8,000, roughly 3% above current levels. However, here is the “risk” for your portfolio: while there is 3% to gain, the market sits roughly 10% above its 200-day moving average, one of the widest stretches of this entire cycle. Pay attention to the math: for every new dollar you invest, you risk $3.33 in losses.
When the upside is a coin-flip 3%, and the downside air pocket is roughly three times larger, committing fresh capital in size into record highs right here is the textbook definition of poor risk-reward. That skew doesn’t argue for selling, but does argue for how you participate, which is why the following tactics make sense.
Does that mean sell everything and hide? No. It means take the gifts the market is handing you now, while it is still handing them out. Such is the discipline that separates managing risk from trying to time the top.
Manage risk into the strength, not after it breaks. I hope this helps.
Related Markets
All MarketsMarket data may be delayed. Not financial advice.
💡 AI analysis provides alternative perspectives on current events