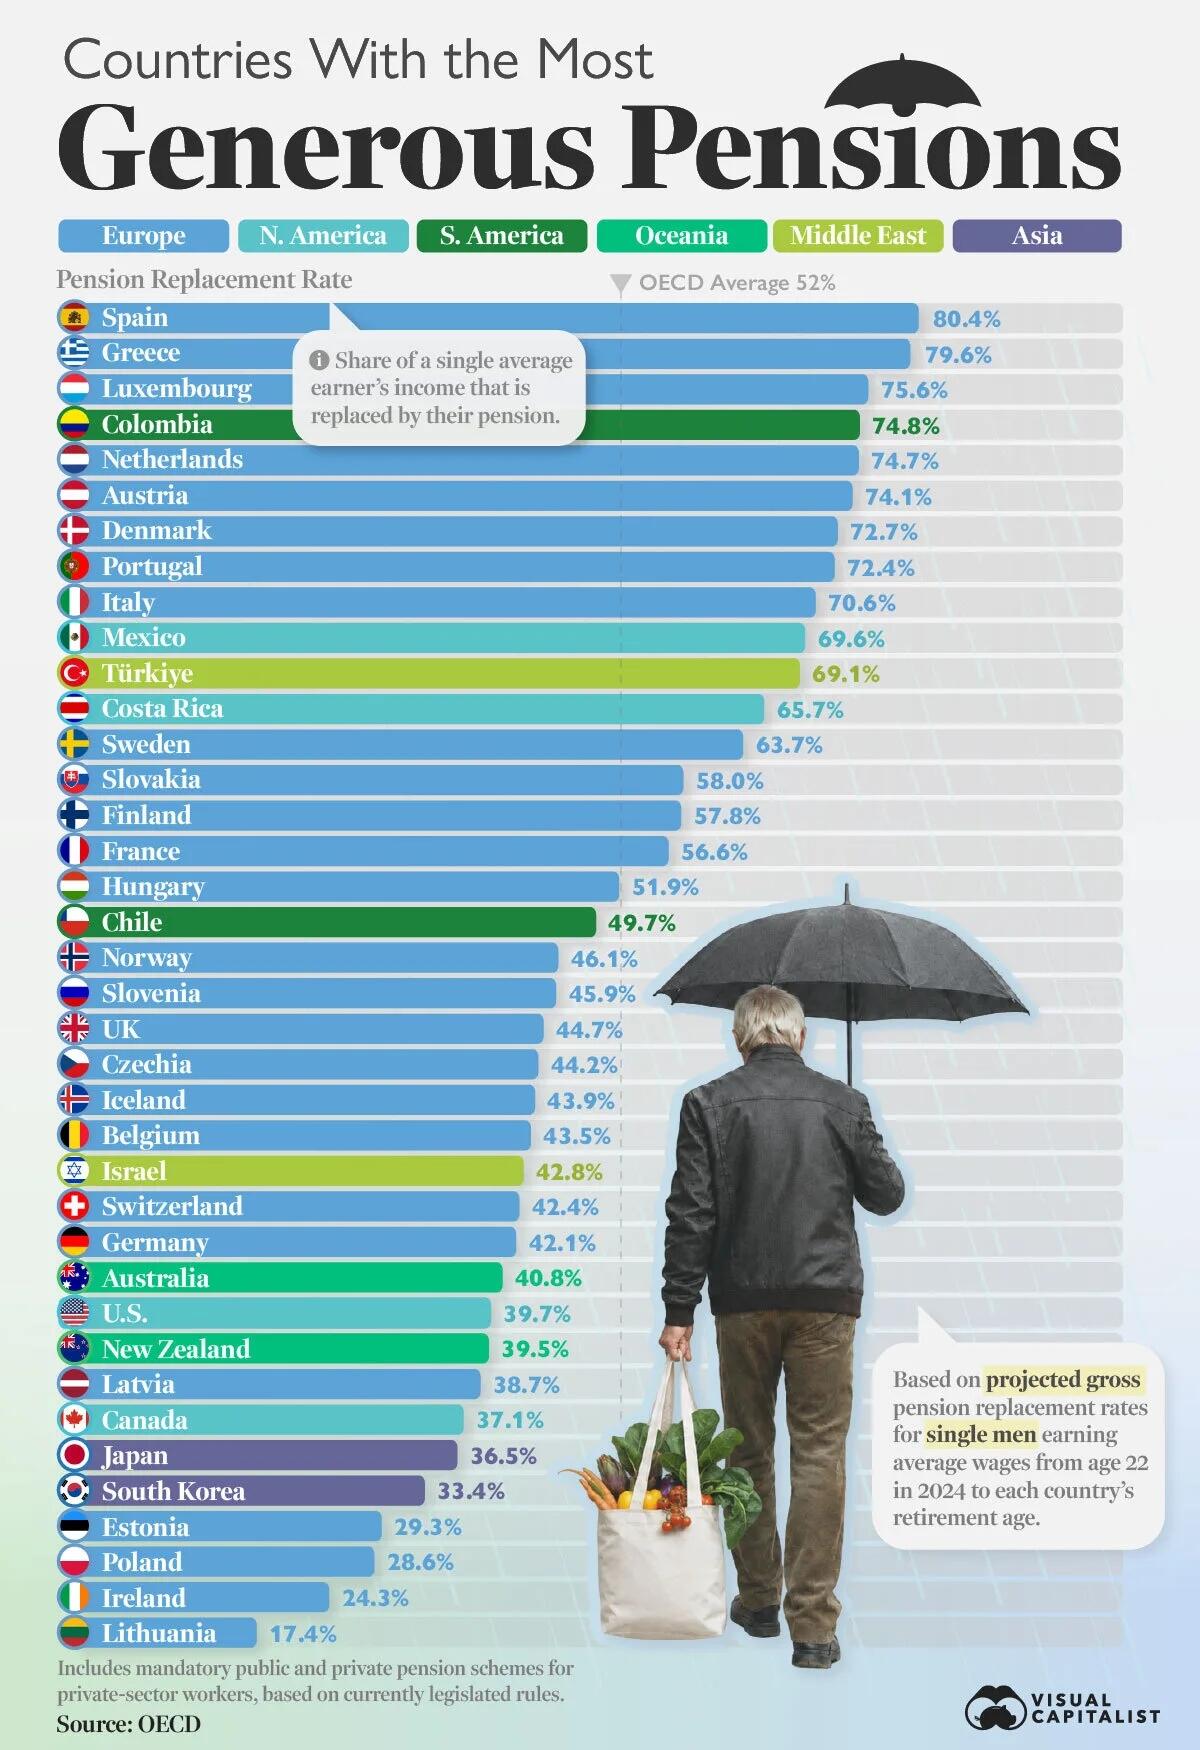
Spain & Greece Have The Best Pension/Salary Replacement Rate In The World

The short version
- Depending on the country, the answer ranges from more than 80% to less than 20%.
- This graphic, via Visual Capitalist's Dorothy Neufeld , ranks countries by their projected gross pension replacement rate, based on data from the OECD .
- The rate compares pension benefits with pre-retirement earnings, with both measured before taxes and contributions.
- Estimates are for an average earner entering the workforce at age 22 in 2024 and include mandatory public and private pensions, but exclude voluntary private retirement savings.
- Spain Leads the Ranking Southern European countries dominate the top of the ranking, with Spain, Greece, Portugal, and Italy all placing in the top 10.
The story
How much of your paycheck would a pension replace in retirement?
Depending on the country, the answer ranges from more than 80% to less than 20%.
This graphic, via Visual Capitalist's Dorothy Neufeld, ranks countries by their projected gross pension replacement rate, based on data from the OECD. The rate compares pension benefits with pre-retirement earnings, with both measured before taxes and contributions.
Estimates are for an average earner entering the workforce at age 22 in 2024 and include mandatory public and private pensions, but exclude voluntary private retirement savings.
Spain Leads the Ranking
Southern European countries dominate the top of the ranking, with Spain, Greece, Portugal, and Italy all placing in the top 10. Spain and Greece stand out at 80.4% and 79.6%, respectively.
| Rank | Country | Pension Replacement Rate |
|---|---|---|
| 1 | 🇪🇸 Spain | 80.4% |
| 2 | 🇬🇷 Greece | 79.6% |
| 3 | 🇱🇺 Luxembourg | 75.6% |
| 4 | 🇨🇴 Colombia | 74.8% |
| 5 | 🇳🇱 Netherlands | 74.7% |
| 6 | 🇦🇹 Austria | 74.1% |
| 7 | 🇩🇰 Denmark | 72.7% |
| 8 | 🇵🇹 Portugal | 72.4% |
| 9 | 🇮🇹 Italy | 70.6% |
| 10 | 🇲🇽 Mexico | 69.6% |
| 11 | 🇹🇷 Türkiye | 69.1% |
| 12 | 🇨🇷 Costa Rica | 65.7% |
| 13 | 🇸🇪 Sweden | 63.7% |
| 14 | 🇸🇰 Slovakia | 58.0% |
| 15 | 🇫🇮 Finland | 57.8% |
| 16 | 🇫🇷 France | 56.6% |
| 17 | 🇭🇺 Hungary | 51.9% |
| 18 | 🇨🇱 Chile | 49.7% |
| 19 | 🇳🇴 Norway | 46.1% |
| 20 | 🇸🇮 Slovenia | 45.9% |
| 21 | 🇬🇧 UK | 44.7% |
| 22 | 🇨🇿 Czechia | 44.2% |
| 23 | 🇮🇸 Iceland | 43.9% |
| 24 | 🇧🇪 Belgium | 43.5% |
| 25 | 🇮🇱 Israel | 42.8% |
| 26 | 🇨🇭 Switzerland | 42.4% |
| 27 | 🇩🇪 Germany | 42.1% |
| 28 | 🇦🇺 Australia | 40.8% |
| 29 | 🇺🇸 U.S. | 39.7% |
| 30 | 🇳🇿 New Zealand | 39.5% |
| 31 | 🇱🇻 Latvia | 38.7% |
| 32 | 🇨🇦 Canada | 37.1% |
| 33 | 🇯🇵 Japan | 36.5% |
| 34 | 🇰🇷 S. Korea | 33.4% |
| 35 | 🇪🇪 Estonia | 29.3% |
| 36 | 🇵🇱 Poland | 28.6% |
| 37 | 🇮🇪 Ireland | 24.3% |
| 38 | 🇱🇹 Lithuania | 17.4% |
| -- | 🌐 OECD Average | 52.0% |
National prosperity is not a reliable predictor of pension replacement rates. Mexico and Türkiye are both near 70%, while Germany stands at 42.1% and the U.S. at 39.7%, reflecting substantial differences in how national retirement systems are structured.
At the bottom, Lithuania's replacement rate is just 17.4%, less than one-quarter of Spain's 80.4%. South Korea and Japan also rank relatively low, at 33.4% and 36.5%, respectively.
Where Low Pensions Meet High Senior Poverty
A low replacement rate does not automatically mean high senior poverty, but several countries near the bottom of the pension ranking also have elevated old-age poverty rates. In Lithuania, more than 20% of people aged 65 and older live in relative income poverty.
The pattern extends across the Baltics. Old-age poverty exceeds 30% in Estonia and Latvia, compared with an OECD average of 14.8%. In the U.S., the rate is also relatively high at 22.9%.
At the other extreme, the Netherlands combines a 74.7% replacement rate with an old-age poverty rate of just 4.6%. Denmark, Finland, and Norway also have poverty rates at or below 5%.
Replacement rates are only one part of retirement security, but these comparisons show how differently pension systems replace workers' earnings across the OECD.
To learn more about this topic, check out this graphic on the annual cost of retirement by state.
Related Markets
All MarketsMarket data may be delayed. Not financial advice.
Powered by Gab AI
The Story At A Glance
Reading this article now — analysis appears below
💡 AI analysis provides alternative perspectives on current events