Market Leadership Is Narrow, Increasing Summer Risk

The short version
- The semiconductor names that powered the rally became the source of Friday’s selling.
- Intel fell 5%, Micron 4%, AMD 3%, and Nvidia 4.4%.
- From a purely technical standpoint, Friday’s reversal was the first real distribution day in three weeks and the mean-reversion signal we have been flagging.
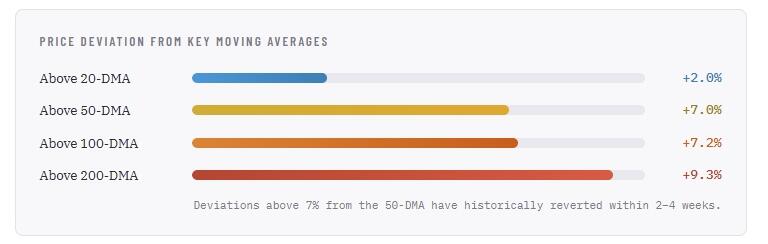
- At 7.0% above the 50-DMA (6,921) and 9.3% above the 200-DMA (6,780) , the index is stretched to a degree that has preceded every meaningful pullback over the past two years.
- The RSI, however, tells a more nuanced story: at 67.15, it has already pulled back below the 70 overbought threshold.
The story
Authored by Lance Roberts via RealInvestmentAdvice.com,
📈Technical Backdrop – Friday Selloff Tests The Tape
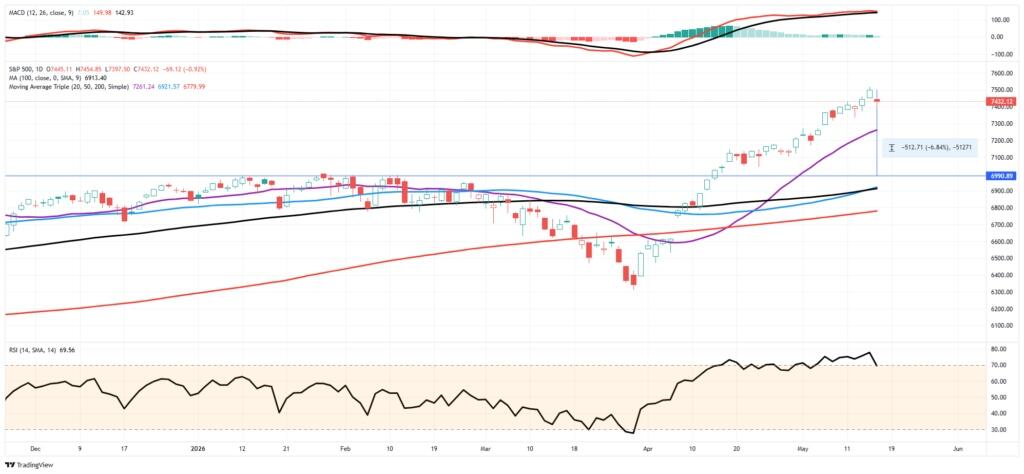
The S&P 500 closed Friday at 7,408.50, surrendering Thursday’s historic first close above 7,500 with a 1.24% decline. The semiconductor names that powered the rally became the source of Friday’s selling. Intel fell 5%, Micron 4%, AMD 3%, and Nvidia 4.4%. From a purely technical standpoint, Friday’s reversal was the first real distribution day in three weeks and the mean-reversion signal we have been flagging.
The deviation numbers are the story. At 7.0% above the 50-DMA (6,921) and 9.3% above the 200-DMA (6,780), the index is stretched to a degree that has preceded every meaningful pullback over the past two years. The RSI, however, tells a more nuanced story: at 67.15, it has already pulled back below the 70 overbought threshold. Friday’s selloff did real work in resetting the oscillator. The MACD, while still positive at +1.54, has narrowed significantly from the 40+ readings earlier in the week, with the signal line (148.10) now nearly converging with the MACD line. A bearish crossover is likely on Monday, even if the market stabilizes.
The erratic style rotation we discussed in this week’s Daily Market Commentary, value leading Monday, growth getting slapped Tuesday, then flipping again on Wednesday, intensified into Friday’s close. Single-stock implied volatility is running 2.5x the index VIX, meaning the calm headline masks violent sector-level moves. The gamma feedback loop driving the semiconductor surge works in reverse on the way down: when call flow dries up, market makers sell the underlying to flatten their books. Friday’s action in MU, AMD, INTC, and NVDA is the process beginning.
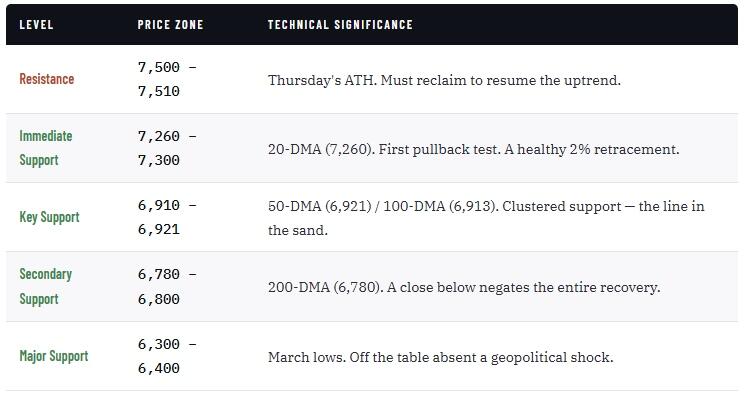
The bull case: the primary trend is up, the RSI has already pulled back below 70 without breaking any support, and the 20-DMA at 7,260 should attract dip buyers on an initial pullback.
The bear case: the 7% and 9.3% deviations above the 50- and 200-DMAs are extreme, the MACD is on the verge of a bearish crossover, and the gamma unwind in semiconductors has only just begun.
The base case is a pullback toward the 20-DMA (7,260), not a breakdown. A deeper correction to the 50/100-DMA cluster near 6,913–6,921 would represent a 6.6% decline from Friday’s close, painful but technically healthy. Use the 20-DMA as the near-term line: a close below opens 6,921 quickly. Trail stops, take profits in extended names, and use any test of the moving average cluster as an opportunity to add.
💰 Market Leadership Is Narrow
Tech is carrying the tape. Most other sectors aren’t. Here’s what history says about that setup, and how we’re positioning around it.
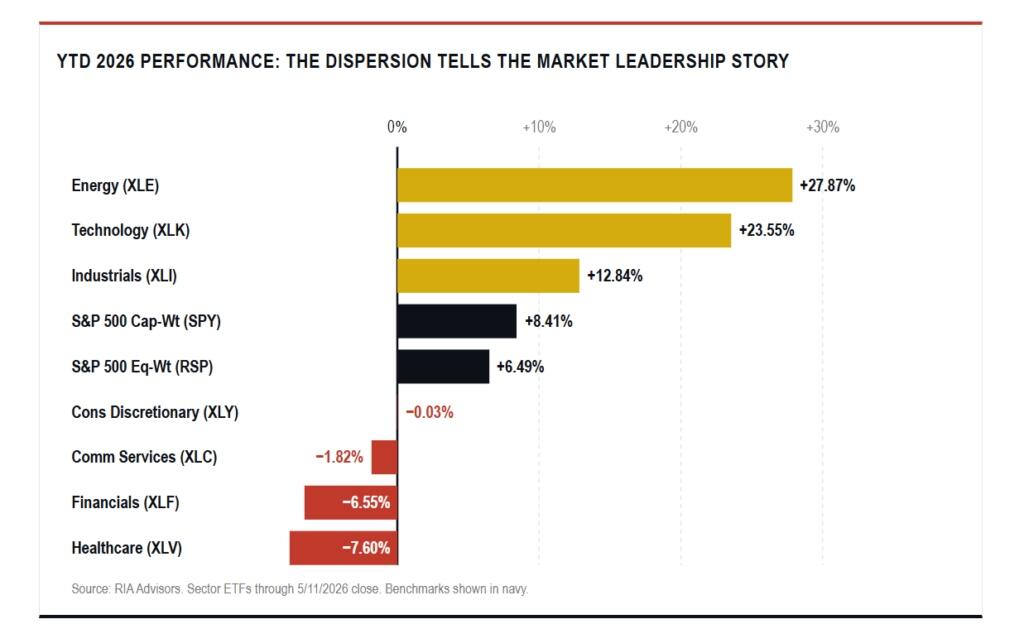
Look under the hood of this year’s rally and the tape isn’t nearly as healthy as the headline number suggests. The S&P 500 sits up roughly 8.4% year-to-date through Friday’s close, but the strength is being carried by a small group of sectors doing all the heavy lifting. Technology is up north of 23%. Healthcare is down almost 8%. Financials have given back more than 6%. Equal-weight, which gives every name an identical vote, has only managed about 6.5%. That gap is the story of 2026 so far, and the story has a name. Narrow market leadership. We’ve seen this movie before, and the ending is rarely as clean as the bulls would like to believe.
Chart of Equal Vs Market Cap Weight
The clearest sign of narrowing market leadership is the spread between the cap-weighted S&P 500 and the equal-weight version. The cap-weighted index, where Apple, Microsoft, Nvidia, and a small group of mega caps carry outsized weight, has outpaced equal-weight by roughly 200 basis points in just over four months. That sounds modest until you remember both indices hold the same 500 companies. The entire performance gap is a weight effect. A handful of names are doing the work for the whole index.
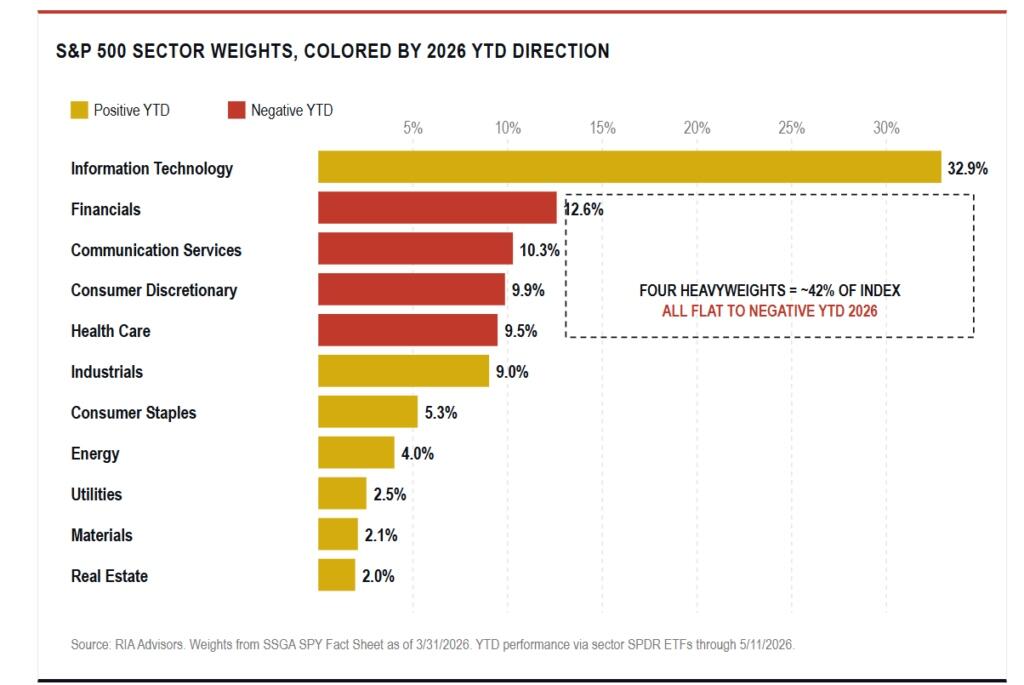
Drill into the table, and the picture sharpens. Technology and Energy are doing the bulk of the index’s heavy lifting, but the way they’re doing it matters. Energy carries just over 4% of the S&P 500 by weight. That’s one of the smallest slots in the index. The sector is the year’s best performer at nearly 28%, but at a 4% weight, even a stellar return only adds about a percentage point to the index. Technology is the opposite story. Tech accounts for roughly a third of the index by weight, and at +23.5% YTD, it alone accounts for the better part of three-quarters of the year’s gain. Strip Tech out, and what’s left of 2026 looks closer to a market in retreat than a market grinding toward new highs.
The bigger problem lies with the heavyweights who aren’t pulling. Financials, the second-largest sector at almost 13% of the index, are down 6.5% year to date. Healthcare, the fifth-largest at 9.5%, has dropped almost 8%. Communication Services at roughly 10% is slightly negative. Consumer Discretionary at nearly 10% is flat. Those four sectors together represent more than 40% of the S&P 500 by weight, and, as a group, they’re a drag rather than a contributor. The bull market isn’t getting help from the heavyweights that should normally be participating, and the dispersion chart above is the visible result.
Here’s why that matters. Sustainable bull markets pass the baton. When Tech gets tired, Financials or Industrials step up. When growth stumbles, value takes over. Right now, the second, third, fourth, and fifth largest sectors of the index aren’t passing the baton. They’re sitting it out. Without those sectors starting to lead, or at minimum starting to participate, this bull market becomes much harder to sustain. The index can ride one sector for a stretch. It can’t ride one sector forever, and that’s exactly what narrow market leadership looks like before it cracks. This isn’t a broad bull market. It’s a Tech-led tape with a thinning bench underneath.
Historical Precedents For Narrow Market Leadership
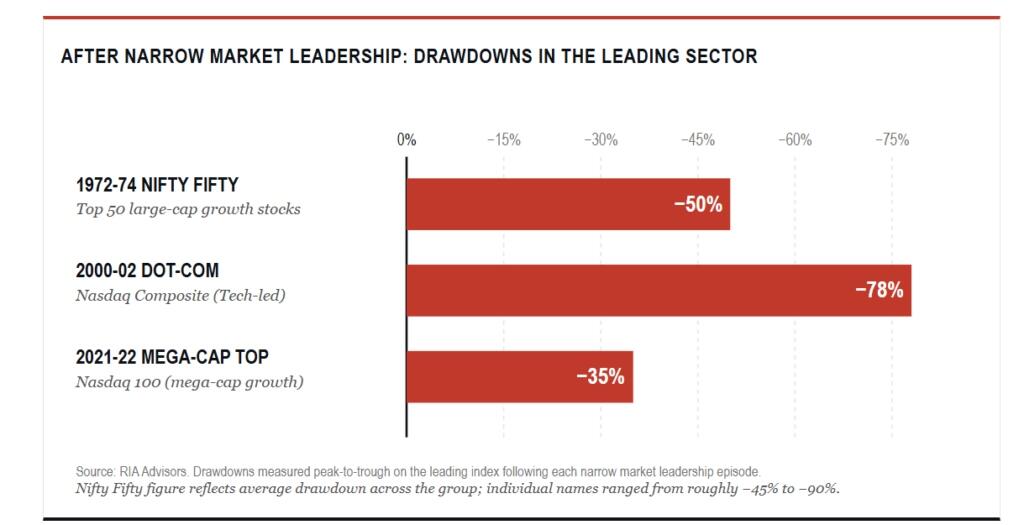
History gives us several clean playbooks for what happens when market leadership concentrates this aggressively into one or two sectors. The first is the Nifty Fifty of the early 1970s. Roughly fifty large-cap growth names carried the index higher into 1972 while the average stock had already started rolling over. When the bear market hit in 1973-74, the Nifty Fifty names lost 45% or more, and the broader index drew down nearly half its value, as participation had been weakening for months beforehand.
The second is the late-1990s dot-com era. By 1999, technology was running away from every other sector. Breadth deteriorated sharply through the back half of that year. The advance-decline line peaked well before the S&P did. When the unwind came in 2000, the Nasdaq lost 78% of its value over the following two and a half years. Importantly, defensive sectors actually outperformed through the worst of it. The third, and the one most relevant for current conditions, is 2021. Mega-cap technology drove the indices to fresh highs while small caps and cyclicals quietly topped out months earlier. The Russell 2000 peaked in November 2021. The S&P 500 didn’t peak until January 2022. The market then spent most of 2022 catching down to what breadth had already been telling investors.
In every one of those cases, narrow market leadership wasn’t the cause of the downturn. However, it was a reliable warning that the underlying participation was thinning out before price followed.
“Investors who own the cap-weighted index right now think they’re diversified across 500 names. In practice, they own a concentrated bet on roughly ten companies with 500 tickers attached.”
What Narrow Market Leadership Tells Us About Risk
Make no mistake, narrow market leadership isn’t an automatic sell signal. Markets can run further than seems reasonable when momentum and passive flows pile into the same names. The 2024-2025 mega-cap run is a recent reminder. But narrow market leadership changes the index’s risk profile in a way most investors don’t appreciate.
Here’s the problem. The same passive flows that drive mega caps higher on the way up reverse on the way down. When the largest weights sell off, they drag the index down, and the already-thin breadth gets even thinner. Drawdowns under narrow market leadership tend to be deeper and faster than drawdowns from broad-based rallies, because there’s no rotation to absorb the selling. Volatility behaves differently, too. When leadership is wide, sector rotation cushions the index. When it isn’t, the index moves with whatever the top five names are doing. Risk goes up. Most investors don’t see it.
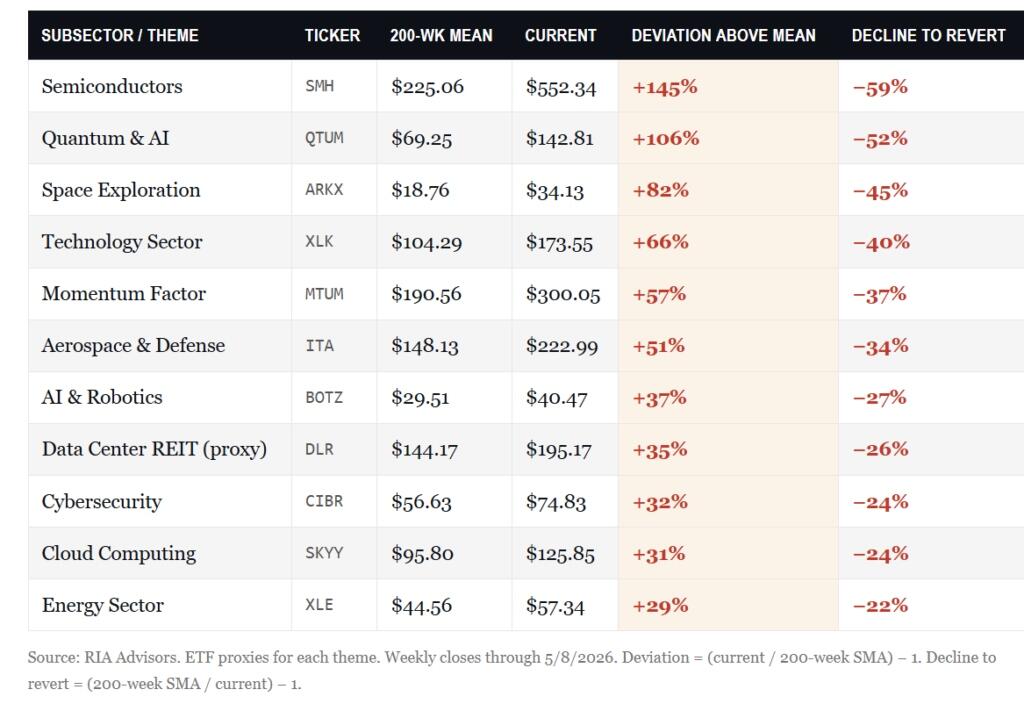
The fingerprints of that risk are clear when you look at how far the leading themes have moved from their long-term means. Reversion is mathematical, not optional. Eventually, prices come back to their averages, and when the deviation gets this stretched, the round trip is rarely small. The table below lists the most extended subsectors of the current market leadership rally, the 200-week moving average for each, and the percentage decline required to reset to that average.
Read the right-hand column. These aren’t 10% pullback numbers. Semiconductors and Quantum themes would need declines in the 50% to 60% range just to touch their 4-year means. The broad Technology sector, the heaviest weighting in the S&P 500, would have to give back roughly 40% to do the same. The Momentum factor itself sits 57% above its long-term mean, indicating the entire momentum trade is concentrated in the same overextended names. Energy, despite leading the year, looks comparatively reasonable at 29% above the mean. Mean reversion isn’t a forecast. It’s an arithmetic statement about how much price has been pulled forward into the current market leadership names. The deeper the deviation, the bigger the eventual round trip.
How To Position Around Narrow Market Leadership
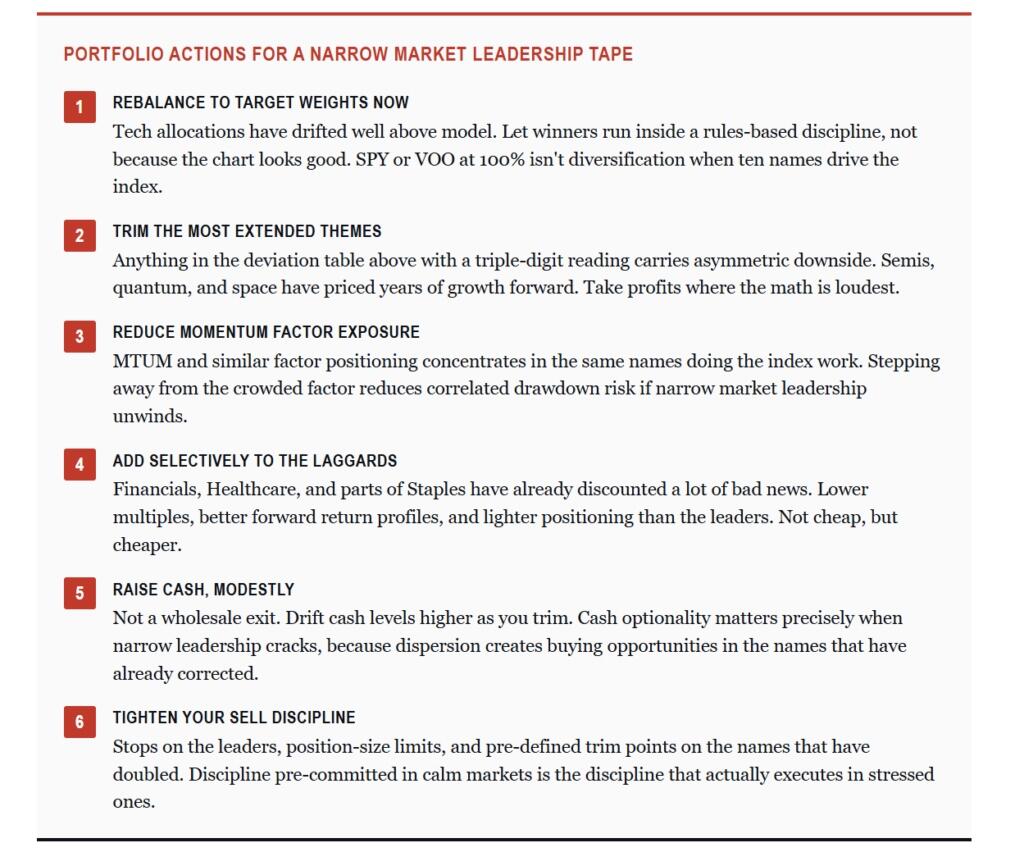
What does this mean for portfolios? Pull the threads together. Tech alone accounts for roughly three-quarters of the index’s gain this year. The four heavyweight sectors below, which together account for more than 40% of the S&P 500, aren’t participating. The historical record for narrow market leadership runs to drawdowns of 35% to 78% in the leading sector. And the most extended themes inside this rally sit 50% to 145% above their long-term means. That’s the setup. The setup dictates the response.
This isn’t about predicting the top. It’s about making sure portfolios reflect what’s already been pulled forward. The actions below are what we’re doing in client books right now.
None of this requires calling the top. We aren’t bearish on the bull market. We are bearish on the assumption that this market leadership will remain durable for another 12 to 18 months without a meaningful reset. The arithmetic of mean reversion and the historical record of narrow tapes both point to the same conclusion.
Position accordingly.
🔑 Key Catalysts Next Week
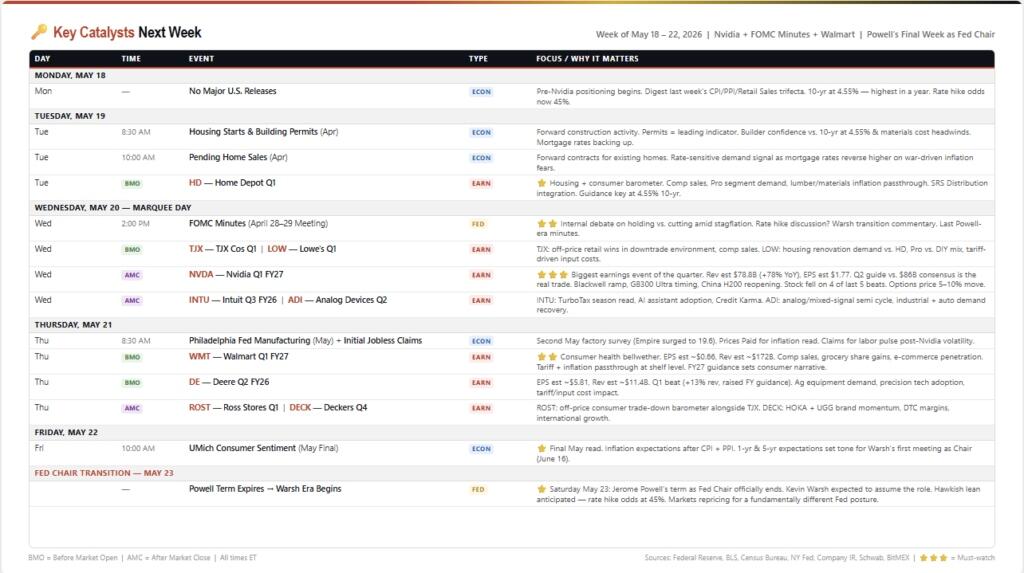
This is the most important week of Q2 and possibly the year. Nvidia reports Wednesday after the close; the FOMC Minutes land Wednesday afternoon; Walmart opens Thursday morning; and Jerome Powell’s fourteen-year tenure at the Federal Reserve ends Saturday. Each of these events alone would dominate a normal week. Together, they arrive at a moment when the 10-year Treasury yield has surged to 4.55%, the highest in a year, and rate hike probabilities have climbed from 1% a month ago to 45% today. The regime is shifting in real time.
However, Wednesday is a collision day that will define the markets next week. The FOMC Minutes from the April 28–29 meeting drop at 2:00 PM, and they arrive carrying a question the market has never had to ask in this cycle: did anyone on the committee discuss raising rates? With core CPI reaccelerating, oil elevated by the Iran conflict, and the 10-year yield climbing, the minutes will reveal whether the internal conversation has shifted from “when do we cut” to “do we need to hike.” Any hawkish surprise, even a single paragraph acknowledging that hikes were discussed, would detonate the rate-sensitive trade.
Three hours later, Nvidia reports Q1 FY2027. Consensus expects $78.8 billion in revenue, 78% year-over-year growth, and $1.77 in EPS, both above the company’s own $78 billion guidance. But the Q1 number is almost beside the point. The real trade is the Q2 guide versus the $86 billion consensus, Blackwell ramp and GB300 Ultra timing, and any commentary on China H200 reopening after the export restrictions effectively zeroed out Chinese data center revenue. The stock has fallen on four of its last five earnings beats, and options are pricing a 5–10% move, in either direction.
Thursday is the consumer verdict. Walmart before the open is the definitive Main Street read. Estimated revenue is $172 billion, grocery share gains, e-commerce penetration, and critically, how much tariff and inflation costs are being passed through at the shelf level versus absorbed in margin will be key. This is where we learn whether the consumer held up through $100 oil and 4.55% Treasury yields or started to crack. Walmart’s full-year guidance will set the consumer narrative for Q2.
Bottom line: Nvidia tells us whether the AI capex cycle is still accelerating. The FOMC Minutes tell us whether the Fed is considering tightening. Walmart tells us whether consumers are surviving. And Saturday, a new Fed Chair takes over with a fundamentally different worldview. This is the week the narrative for the rest of 2026 gets written. Hedge your book before Wednesday at 2:00 PM.
Trade accordingly.
Related Markets
All MarketsMarket data may be delayed. Not financial advice.
How other outlets covered this
Compare allAlto found this story at 4 outlets. Same event, different framing — compare the headlines.
- ZeroHedgeFutures Bounce As Brent Drops Under $90 On Renewed Iran Optimism2 days ago
- VentureBeatNo cloud, no GPUs, no problem: Liquid AI's new model LFM2.5-2.6B brings powerful AI agents to devices as small as a Raspberry Pi20 days ago
- The VergeTariffs didn’t bring manufacturing jobs back to the USabout 1 month ago
- APBritain’s Starmer fights for his job as calls for his ouster grow after local election losses4 months ago
How this story developed
Full timelineAlto has tracked this across 34 days of coverage from 4 outlets.
Powered by Gab AI
The Story At A Glance
Reading this article now — analysis appears below
💡 AI analysis provides alternative perspectives on current events