Most Americans Can't Afford New Homes
The short version
- A new analysis from the National Association of Home Builders ( NAHB ) shows that 65% of U.S. households are priced out of newly built homes…
- In some parts of the country, the situation is even more extreme.
- More than 80% of households can’t afford a new home, highlighting how widespread the affordability gap has become.
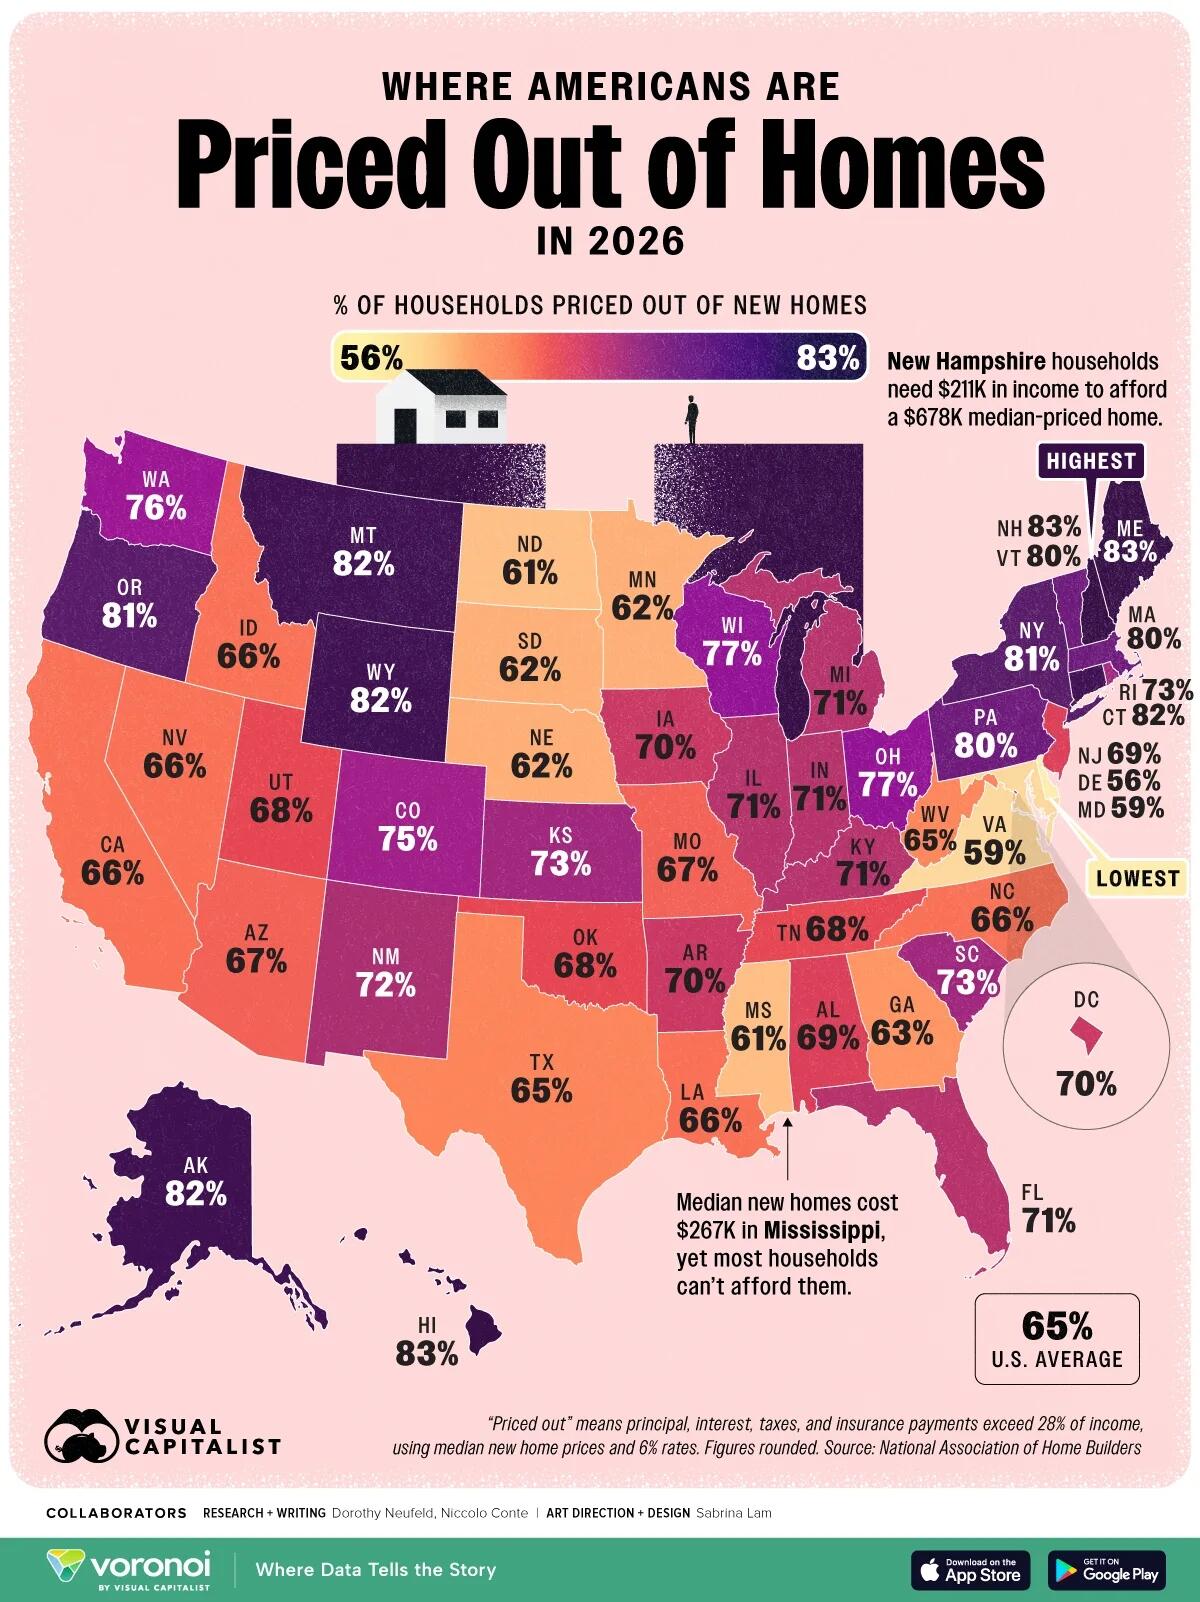
- This map, via Visual Capitalist's Dorosthy Neufeld, shows where Americans are being priced out and where barriers to homeownership are highest.
- Ranked: Where Americans Are Most Priced Out of New Homes At the extreme end, buying a new home is nearly out of reach.
The story
Most Americans can’t afford a new home.
A new analysis from the National Association of Home Builders (NAHB) shows that 65% of U.S. households are priced out of newly built homes, based on current prices and mortgage rates.
In some parts of the country, the situation is even more extreme. More than 80% of households can’t afford a new home, highlighting how widespread the affordability gap has become.
This map, via Visual Capitalist's Dorosthy Neufeld, shows where Americans are being priced out and where barriers to homeownership are highest.
Ranked: Where Americans Are Most Priced Out of New Homes
At the extreme end, buying a new home is nearly out of reach. In New Hampshire, 83.4% of households are priced out of a new median-priced home.
In total, 11 states have at least 80% of households locked out.
This table shows the share of households priced out of new homes by state in 2026. A household is considered “priced out” if total housing costs—principal, interest, taxes, and insurance—exceed 28% of income, based on median new home prices and a 6% mortgage rate.
| State | % of Households Priced Out of New Homes |
Median New Home Price | Income Needed to Qualify |
|---|---|---|---|
| New Hampshire | 83.4% | $677,982 | $211,080 |
| Hawaii | 83.0% | $884,781 | $234,818 |
| Maine | 82.7% | $548,493 | $160,714 |
| Alaska | 82.2% | $627,077 | $188,313 |
| Connecticut | 81.8% | $696,752 | $224,811 |
| Wyoming | 81.8% | $580,627 | $164,982 |
| Montana | 81.5% | $495,610 | $141,997 |
| Oregon | 81.0% | $608,135 | $173,717 |
| New York | 80.5% | $656,108 | $204,163 |
| Vermont | 80.1% | $580,627 | $181,064 |
| Pennsylvania | 80.0% | $528,370 | $160,900 |
| Massachusetts | 79.8% | $836,236 | $246,370 |
| Wisconsin | 77.3% | $485,449 | $149,085 |
| Ohio | 76.5% | $443,646 | $137,310 |
| Washington | 76.1% | $649,812 | $185,213 |
| Colorado | 75.1% | $644,149 | $179,928 |
| Kansas | 73.4% | $401,237 | $128,372 |
| Rhode Island | 72.9% | $578,724 | $174,451 |
| South Carolina | 72.5% | $421,098 | $118,180 |
| New Mexico | 71.7% | $362,847 | $104,055 |
| Illinois | 71.3% | $428,712 | $143,374 |
| Michigan | 71.3% | $371,503 | $122,158 |
| Kentucky | 71.3% | $398,741 | $109,299 |
| Florida | 71.1% | $429,644 | $127,139 |
| Indiana | 70.7% | $418,993 | $123,219 |
| District of Columbia | 70.1% | $836,441 | $232,260 |
| Iowa | 70.0% | $348,337 | $120,598 |
| Arkansas | 70.0% | $381,881 | $100,780 |
| Alabama | 69.2% | $375,944 | $106,586 |
| New Jersey | 69.1% | $527,069 | $172,356 |
| Utah | 68.2% | $531,151 | $145,638 |
| Tennessee | 67.7% | $399,580 | $111,631 |
| Oklahoma | 67.6% | $351,771 | $107,846 |
| Arizona | 66.6% | $446,796 | $122,364 |
| Missouri | 66.6% | $371,515 | $111,332 |
| Idaho | 66.4% | $430,280 | $117,615 |
| North Carolina | 66.4% | $394,058 | $112,263 |
| Louisiana | 66.2% | $318,728 | $95,895 |
| California | 65.6% | $545,892 | $153,471 |
| Nevada | 65.5% | $420,782 | $115,555 |
| West Virginia | 64.8% | $308,607 | $88,071 |
| Texas | 64.5% | $369,798 | $117,131 |
| Georgia | 62.5% | $374,579 | $109,329 |
| Minnesota | 62.1% | $402,209 | $122,025 |
| Nebraska | 62.0% | $328,603 | $107,185 |
| South Dakota | 62.0% | $346,894 | $106,233 |
| North Dakota | 61.4% | $382,451 | $116,480 |
| Mississippi | 61.1% | $266,837 | $80,174 |
| Virginia | 58.9% | $429,184 | $122,542 |
| Maryland | 58.5% | $432,949 | $127,559 |
| Delaware | 56.0% | $376,478 | $104,282 |
While high-cost states like Hawaii and Massachusetts rank among the least affordable, others such as Maine and Wyoming show that affordability pressures are no longer limited to major metro areas.
Affordability Isn’t Just a Coastal Problem
The most striking takeaway is how universal the problem has become.
Even in lower-cost states like Mississippi ($267K) and West Virginia ($309K), a majority of households are still priced out new homes. While buyers need under $90,000 in income—compared to over $200,000 in the least affordable markets—that threshold remains out of reach for many.
In other words, moving to a cheaper state is no longer a reliable solution. Instead, the data points to a deeper issue, which is that incomes have not kept pace with rising housing costs across the country.
While existing homes can be more affordable than new construction, this data highlights a key constraint: much of the new housing supply entering the market is already out of reach for most households.
The Bigger Picture
As new home prices continue to outpace income growth, the gap between who can and can’t afford newly built homes is widening. That shift is reshaping where Americans live, how they build wealth, and whether homeownership is attainable at all.
If even the most affordable states are out of reach for most households looking at new homes, the question becomes harder to ignore: where can buyers realistically go next?
Learn More on the Voronoi App
To learn more about this topic, check out this graphic on where wealth is moving in America.
Related Markets
All MarketsMarket data may be delayed. Not financial advice.
How other outlets covered this
Compare allAlto found this story at 5 outlets. Same event, different framing — compare the headlines.
- ZeroHedgeNew Home Sales Collapsed In July As Consumer Confidence Hit 7-Month Lows2 days ago
- Fox NewsTrump’s affordability plan faces conservative pushback as pocketbook issues loom over midterms9 days ago
- AxiosTrump snubs housing bill to pressure GOPabout 2 months ago
- NPRPolitics chat: Trump's July 4 speech, financial disclosures; Supreme Court rulingsabout 2 months ago
- APSenate is set to pass a bipartisan housing bill aimed at increasing supply and lowering prices2 months ago
How this story developed
Full timelineAlto has tracked this across 27 days of coverage from 5 outlets.
Powered by Gab AI
The Story At A Glance
Reading this article now — analysis appears below
💡 AI analysis provides alternative perspectives on current events