Mapping Americans' Per Capita Health Care Spending By State
The short version
- Bureau of Economic Analysis highlights the differences in per-capita health care spending across the country in 2024.
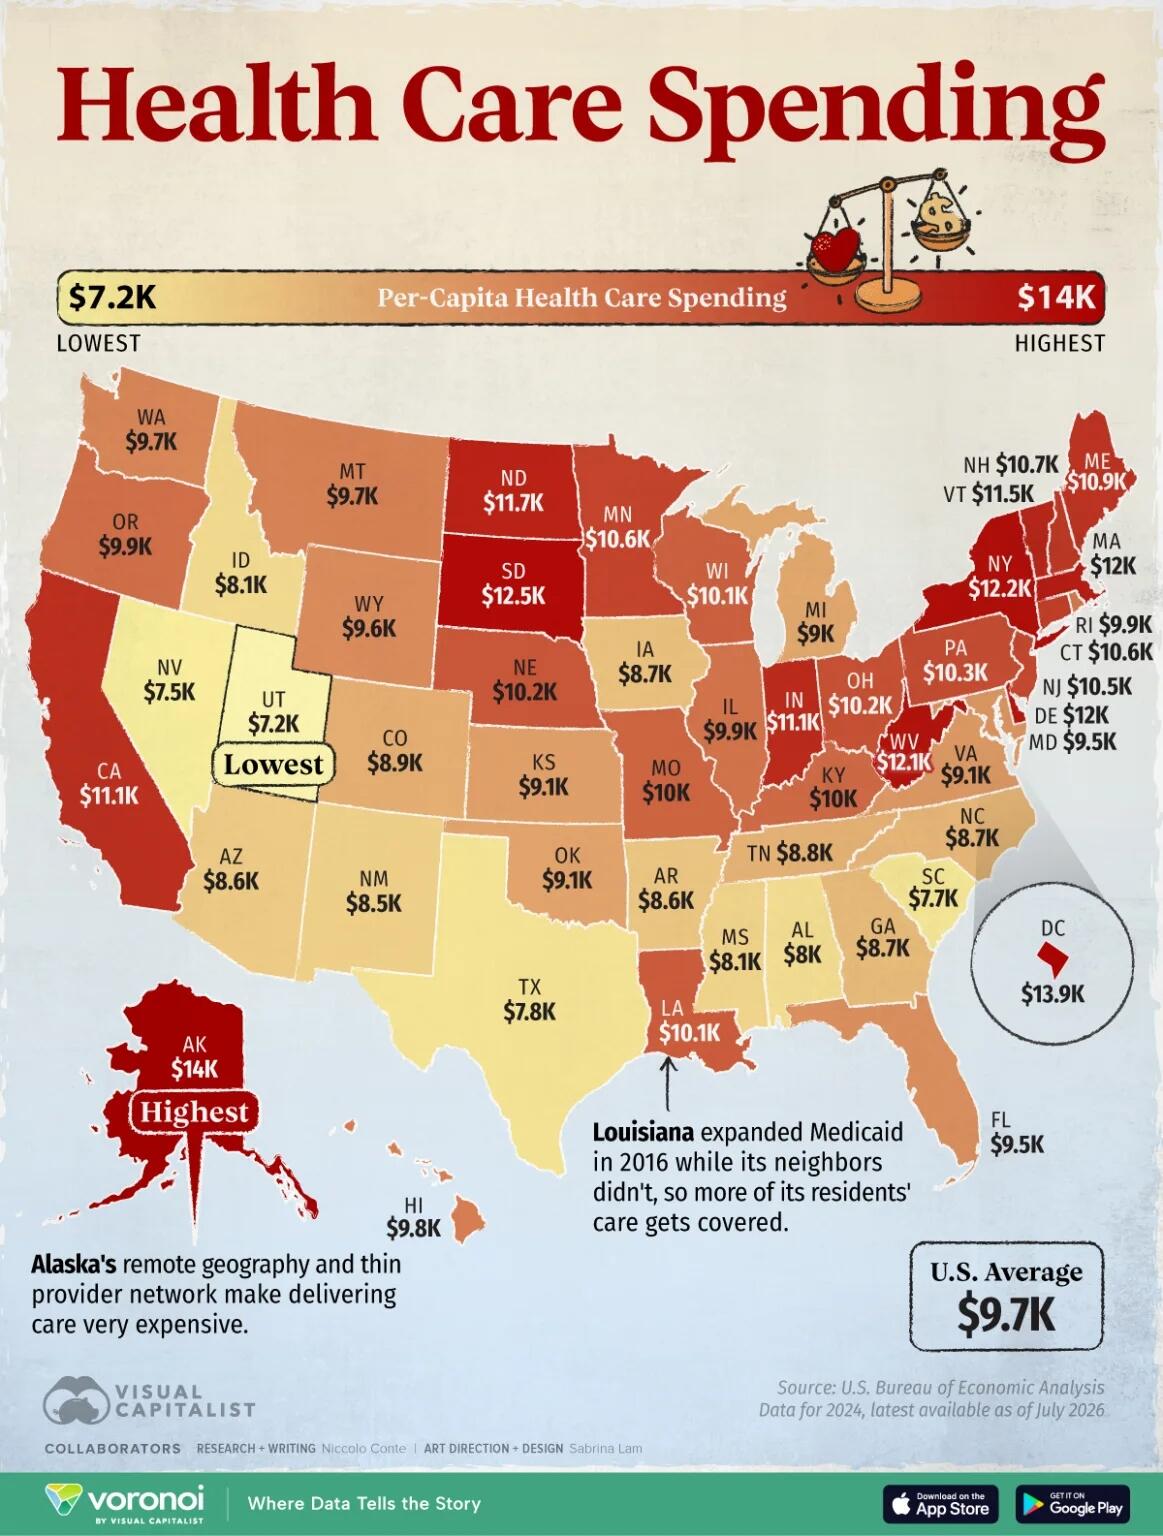
- The map below, via Visual Capitalist's Srijaa Chatterjee, ranks every state using the latest Personal Consumption Expenditures by State data from the BEA.
- Figures are reported in current dollars and allocated according to residents’ state of residence.
- Which States Spend the Most on Health Care?
- Several Northeastern states, along with South Dakota and Washington, D.C., also ranked near the top.
The story
Health care represents a major share of consumer spending in America, but the amount spent per resident varies considerably by location.
New data from the U.S. Bureau of Economic Analysis highlights the differences in per-capita health care spending across the country in 2024.
The map below, via Visual Capitalist's Srijaa Chatterjee, ranks every state using the latest Personal Consumption Expenditures by State data from the BEA. Figures are reported in current dollars and allocated according to residents’ state of residence.
Which States Spend the Most on Health Care?
Below is a ranking of states based on per-person health care spending:
| Rank | State | Per-Capita Health Care Spending |
|---|---|---|
| 1 | Alaska | $14,044 |
| 2 | District of Columbia | $13,865 |
| 3 | South Dakota | $12,451 |
| 4 | New York | $12,221 |
| 5 | West Virginia | $12,055 |
| 6 | Delaware | $11,987 |
| 7 | Massachusetts | $11,985 |
| 8 | North Dakota | $11,667 |
| 9 | Vermont | $11,493 |
| 10 | Indiana | $11,071 |
| 11 | California | $11,054 |
| 12 | Maine | $10,913 |
| 13 | New Hampshire | $10,682 |
| 14 | Connecticut | $10,639 |
| 15 | Minnesota | $10,567 |
| 16 | New Jersey | $10,468 |
| 17 | Pennsylvania | $10,262 |
| 18 | Ohio | $10,202 |
| 19 | Nebraska | $10,192 |
| 20 | Louisiana | $10,148 |
| 21 | Wisconsin | $10,079 |
| 22 | Missouri | $10,036 |
| 23 | Kentucky | $9,964 |
| 24 | Oregon | $9,931 |
| 25 | Illinois | $9,895 |
| 26 | Rhode Island | $9,864 |
| 27 | Hawaii | $9,808 |
| 28 | Montana | $9,747 |
| 29 | Washington | $9,693 |
| 30 | Wyoming | $9,640 |
| 31 | Florida | $9,545 |
| 32 | Maryland | $9,456 |
| 33 | Virginia | $9,123 |
| 34 | Kansas | $9,066 |
| 35 | Oklahoma | $9,052 |
| 36 | Michigan | $9,023 |
| 37 | Colorado | $8,871 |
| 38 | Tennessee | $8,761 |
| 39 | North Carolina | $8,744 |
| 40 | Georgia | $8,680 |
| 41 | Iowa | $8,660 |
| 42 | Arkansas | $8,562 |
| 43 | Arizona | $8,556 |
| 44 | New Mexico | $8,469 |
| 45 | Mississippi | $8,135 |
| 46 | Idaho | $8,078 |
| 47 | Alabama | $7,980 |
| 48 | Texas | $7,807 |
| 49 | South Carolina | $7,741 |
| 50 | Nevada | $7,536 |
| 51 | Utah | $7,233 |
Alaska spent nearly twice as much per resident on health care as Utah in 2024.
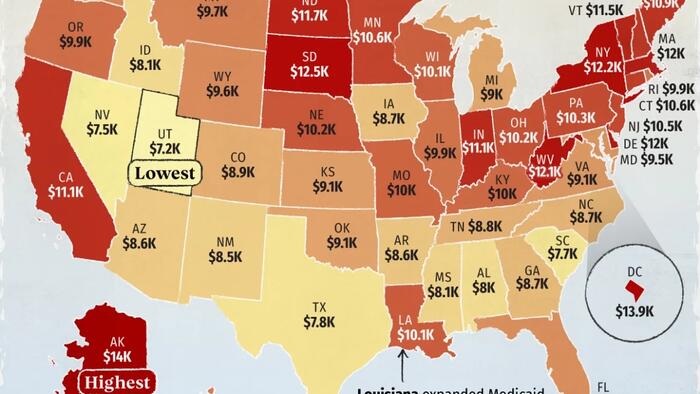
Several Northeastern states, along with South Dakota and Washington, D.C., also ranked near the top. Meanwhile, much of the Mountain West and South recorded below-average spending.
Why Do Some States Spend More Than Others?
Higher spending does not necessarily mean residents receive more medical care.
Numerous studies have found that differences in prices, especially for hospital and physician services, explain much more of the variation in U.S. health spending than differences in how often people use care. Administrative costs, provider wages, and regional labor markets also play major roles.
State-specific factors matter as well. Alaska’s remote geography and limited provider network make delivering care significantly more expensive, while states with older populations often spend more because seniors tend to use more medical services.
Broader insurance coverage can also increase the share of care captured in personal consumption expenditures.
Health Care Spending Continues to Climb
Nationally, health care expenditures continue to rise.
CMS projects U.S. health spending will approach $9 trillion annually by 2034, driven by increased enrollment in Medicare and Medicaid, along with continued growth in health care prices. Despite already spending more per person than any comparable high-income country, the U.S. is expected to devote an even larger share of its economy to health care over the next decade.
International comparisons show the U.S. spends substantially more on health care than other high-income countries, largely because medical services cost more rather than because Americans use dramatically more care.
As national spending continues to rise, the nearly twofold gap between states highlights how geography remains a major factor in what Americans ultimately spend on health care.
If you enjoyed this visualization, check out Americans Pay More for Healthcare, Yet Have Shorter Life Expectancy on the Voronoi app, where you can discover thousands of data-driven charts from trusted sources covering health, economics, markets, and more.
Related Markets
All MarketsMarket data may be delayed. Not financial advice.
How other outlets covered this
Compare allAlto found this story at 2 outlets. Same event, different framing — compare the headlines.
How this story developed
Full timelineAlto has tracked this across 3 days of coverage from 2 outlets.
- Mapping Americans' Per Capita Health Care Spending By StateYou are here
Powered by Gab AI
The Story At A Glance
Reading this article now — analysis appears below
💡 AI analysis provides alternative perspectives on current events